Project - ADA 2019
Chicago Food Inspections
Abstract

Abstract

Food is essential to human beings, in that it not only provides nutrients for survival, but also satisfies the need for social bonding: people like to gather around meals and beverages, be it going out to eat and drink, or over a home-cooked meal. Either way, food facilities such as restaurants, pubs, coffee shops, and grocery stores are a major part of people's daily lives. However, according to the WHO, 1 in 10 people fall ill every year from eating contaminated food, and 420.000 people die each year as a result. This risk is especially high when eating out at restaurants rather than cooking your own meals. Therefore, monitoring and maintaining food safety in food facilities is crucial for the health and general well-being of the population.

Chicago is the third largest city in the United States and is home to more than 16.000 food establishments. The Chicago Department of Public Health’s Food Protection Program aims to ensure that all food preparation in every food establishment across the city is done in compliance with city ordinances and regulations by conducting recurring science-based inspections.

The Chicago Food Inspection dataset will allow us to determine food safety levels in Chicago and what affects them, predict if a food facility will pass the inspections, and maybe even make some generalizations that apply beyond the city of Chicago. In other words, we want to obtain more insights into food-related risks in Chicago and the attention food establishments pay to the health of their customers, as well as use these to help inspectors quickly detect establishments that are a threat to the Public Health. The chosen dataset gives us information from which we wish to extract interesting patterns for our study.


Main Research Questions


  • Do chain restaurants pay more attention to the safety of their customers?
  • What is the relationship between establishment location and safety and how can we realize an interactive map of Chicago that highlights it?
  • Can we find seasonal patterns i.e. are some violations more likely to occur during certain months of the year?
  • Can we predict if a facility will pass an inspection on the basis of the violations and other factors such as facility type, location, etc?

Dataset


In order to achieve our goal, we will use the Chicago Food Inspections dataset provided by the City of Chicago Open Data platform. It is a relatively small .csv dataset (only 220 MB) which contains details about food establishments inspections carried out in the city of Chicago from 01.01.2010 onward. It provides useful information about various aspects of the inspections such as: facility type, violation type, inspection type, risk category or location. The fields are, for the most part, straightforward.

The only column that needs extra processing is the “Violations” column. It stores the encountered violations as free text comprising: the violation code and title followed by comments. The challenge here is to parse the contents of this column using natural language processing techniques in order to identify keywords in the comments that can be used to discover new patterns and trends. Moreover, some columns must be discarded because they contain either redundant or useless information. For example, the “Latitude” and “Longitude” columns are to be discarded because the “Location” column already contains this information. Similarly, the City and State columns must be discarded since the inspections only occurred in Chicago.

Another hurdle in managing the data is the fact that on 01.07.2018, the Chicago Department of Public Health’s Food Protection unit changed its definition of violations. Thus, we will have to conduct extensive research about the violation types, how they changed and how the old ones can be mapped to the new ones. Besides, in order to avoid artifacts of the redefinition of violation types when studying changes in long term trends, two filtered views were created: one showing inspection records through 30.06.2018 and one showing inspection records from 01.07.2018 forward. We thus may use these two filtered datasets for our study.

Finally, the dataset may still contain duplicates inspection reports. Hence, we will also had to add a step in our pre-processing pipeline to account for this inconvenience.


Data Story


We are focused on identifying those factors that affect and can be used to predict which food establishments may be at risk of spreading foodborne illness. This advanced analysis can aid the relatively small number of inspectors to target efficiently and effectively the occurrence of critical violations, a task which is a top Public Health priority.


What is the proportion of high risk food establishments?


Surprisingly, most facilities are high risk establishments and very few of them are low risk ones. The proportion of medium risk establishments is also fairly low. This finding supports further the need for advanced analysis and predictive methods for identifying the most dangerous facilities, as it is highly difficult to pinpoint them among a majority of high risk establishments.


What are the most inspected facility types?


It seems that restaurants, grocery stores and schools are the most inspected facility types.


What is the most frequent inspection type?


The most common type of inspection is Canvass which is performed at a frequency relative to the risk of the establishment as explained in the Inspection type column description. The second most common type of inspection is Complain and it should be interesting to know if these types of inspection are more likely to fail. License inspections are also frequent, done as a requirement for the establishment in order to receive its license to operate since many new food establishments open up in Chicago each year. Finally, inspections for Suspected Food Poisoning (in response to one or more persons claiming to have gotten ill as a result of eating at the establishment), Tag-Removal inspections (inspection of a bar or tavern) and Consultation (when the inspection is done at the request of the owner prior to the opening of the establishment) do not occur really often. Moreover, Re-Inspections can occur for most types of inspections and are indicated as such.


What proportion of the inspections pass?


Despite the concerning number of high risk food establishments, most of them pass the inspections. This might lead us to conclude that both the situation is not as grim as it seems at a first look, but also that it takes a long period of time until the inspectors come across the facilities that are a critical threat to the Public Health.

The results obtained so far also showed us that, although most food establishments are categorised as having High Risk, a much larger proportion of the inspections pass rather than fail. To make matters worse, it seems that most inspections are of type Canvass or License, and only a small percentage is based on complaints which means that the consumers are unaware of the standards the establishments should meet, their own safety or, even worse, the establishments themselves hide their issues very well.


How safe is your favourite chain restaurant/fast-food?


We thought it would be interesting to obtain more insights on chain restaurants/fast-foods inspections since these establishments are supposed to run by stricter rules and to be particularly careful regarding their inspections since a bad report could jeopardize the whole chain. We first decided to select the top 9 chain restaurants. In order to do so, we selected the restaurants which have more than 20 establishments under the same DBA name across the city. We then plotted the evolution of the mean risk throughout the years.

Surprisingly, although 4 out of the top 9 chain restaurants have medium risk, the other 5 have a high risk and none have a low risk. However, having a high risk doesn't mean that the inspection will fail. So next we decided to look more into how the number of violations influences the result of an inspection.


What is the effect of the number of violations on the inspection's outcome?


For the dataset, we only look at the 3 most relevant categories regarding the Results: Fail, Pass and Pass with conditions. We plotted the boxplots corresponding to those 3 categories representing the number of violations. Unsurprisingly, the failed inspections were the ones with the most violations. An establishment with more violations is thus most likely to fail the inspection.
Nevertheless, we can observe some outliers on the boxplots: some facilities with a high number of violations still passed the inspection. One explanation for this is that some violations are more critical than others and are more likely to make an inspection fail. Furthermore, the result is determined by a combination of several violations, and not by the cumulated independent effect of each violation. Finally, the severity of a violation varies from an inspection to another: one facility may have not fulfilled several aspects of the violation.


What are the differences between violations in terms of severity?


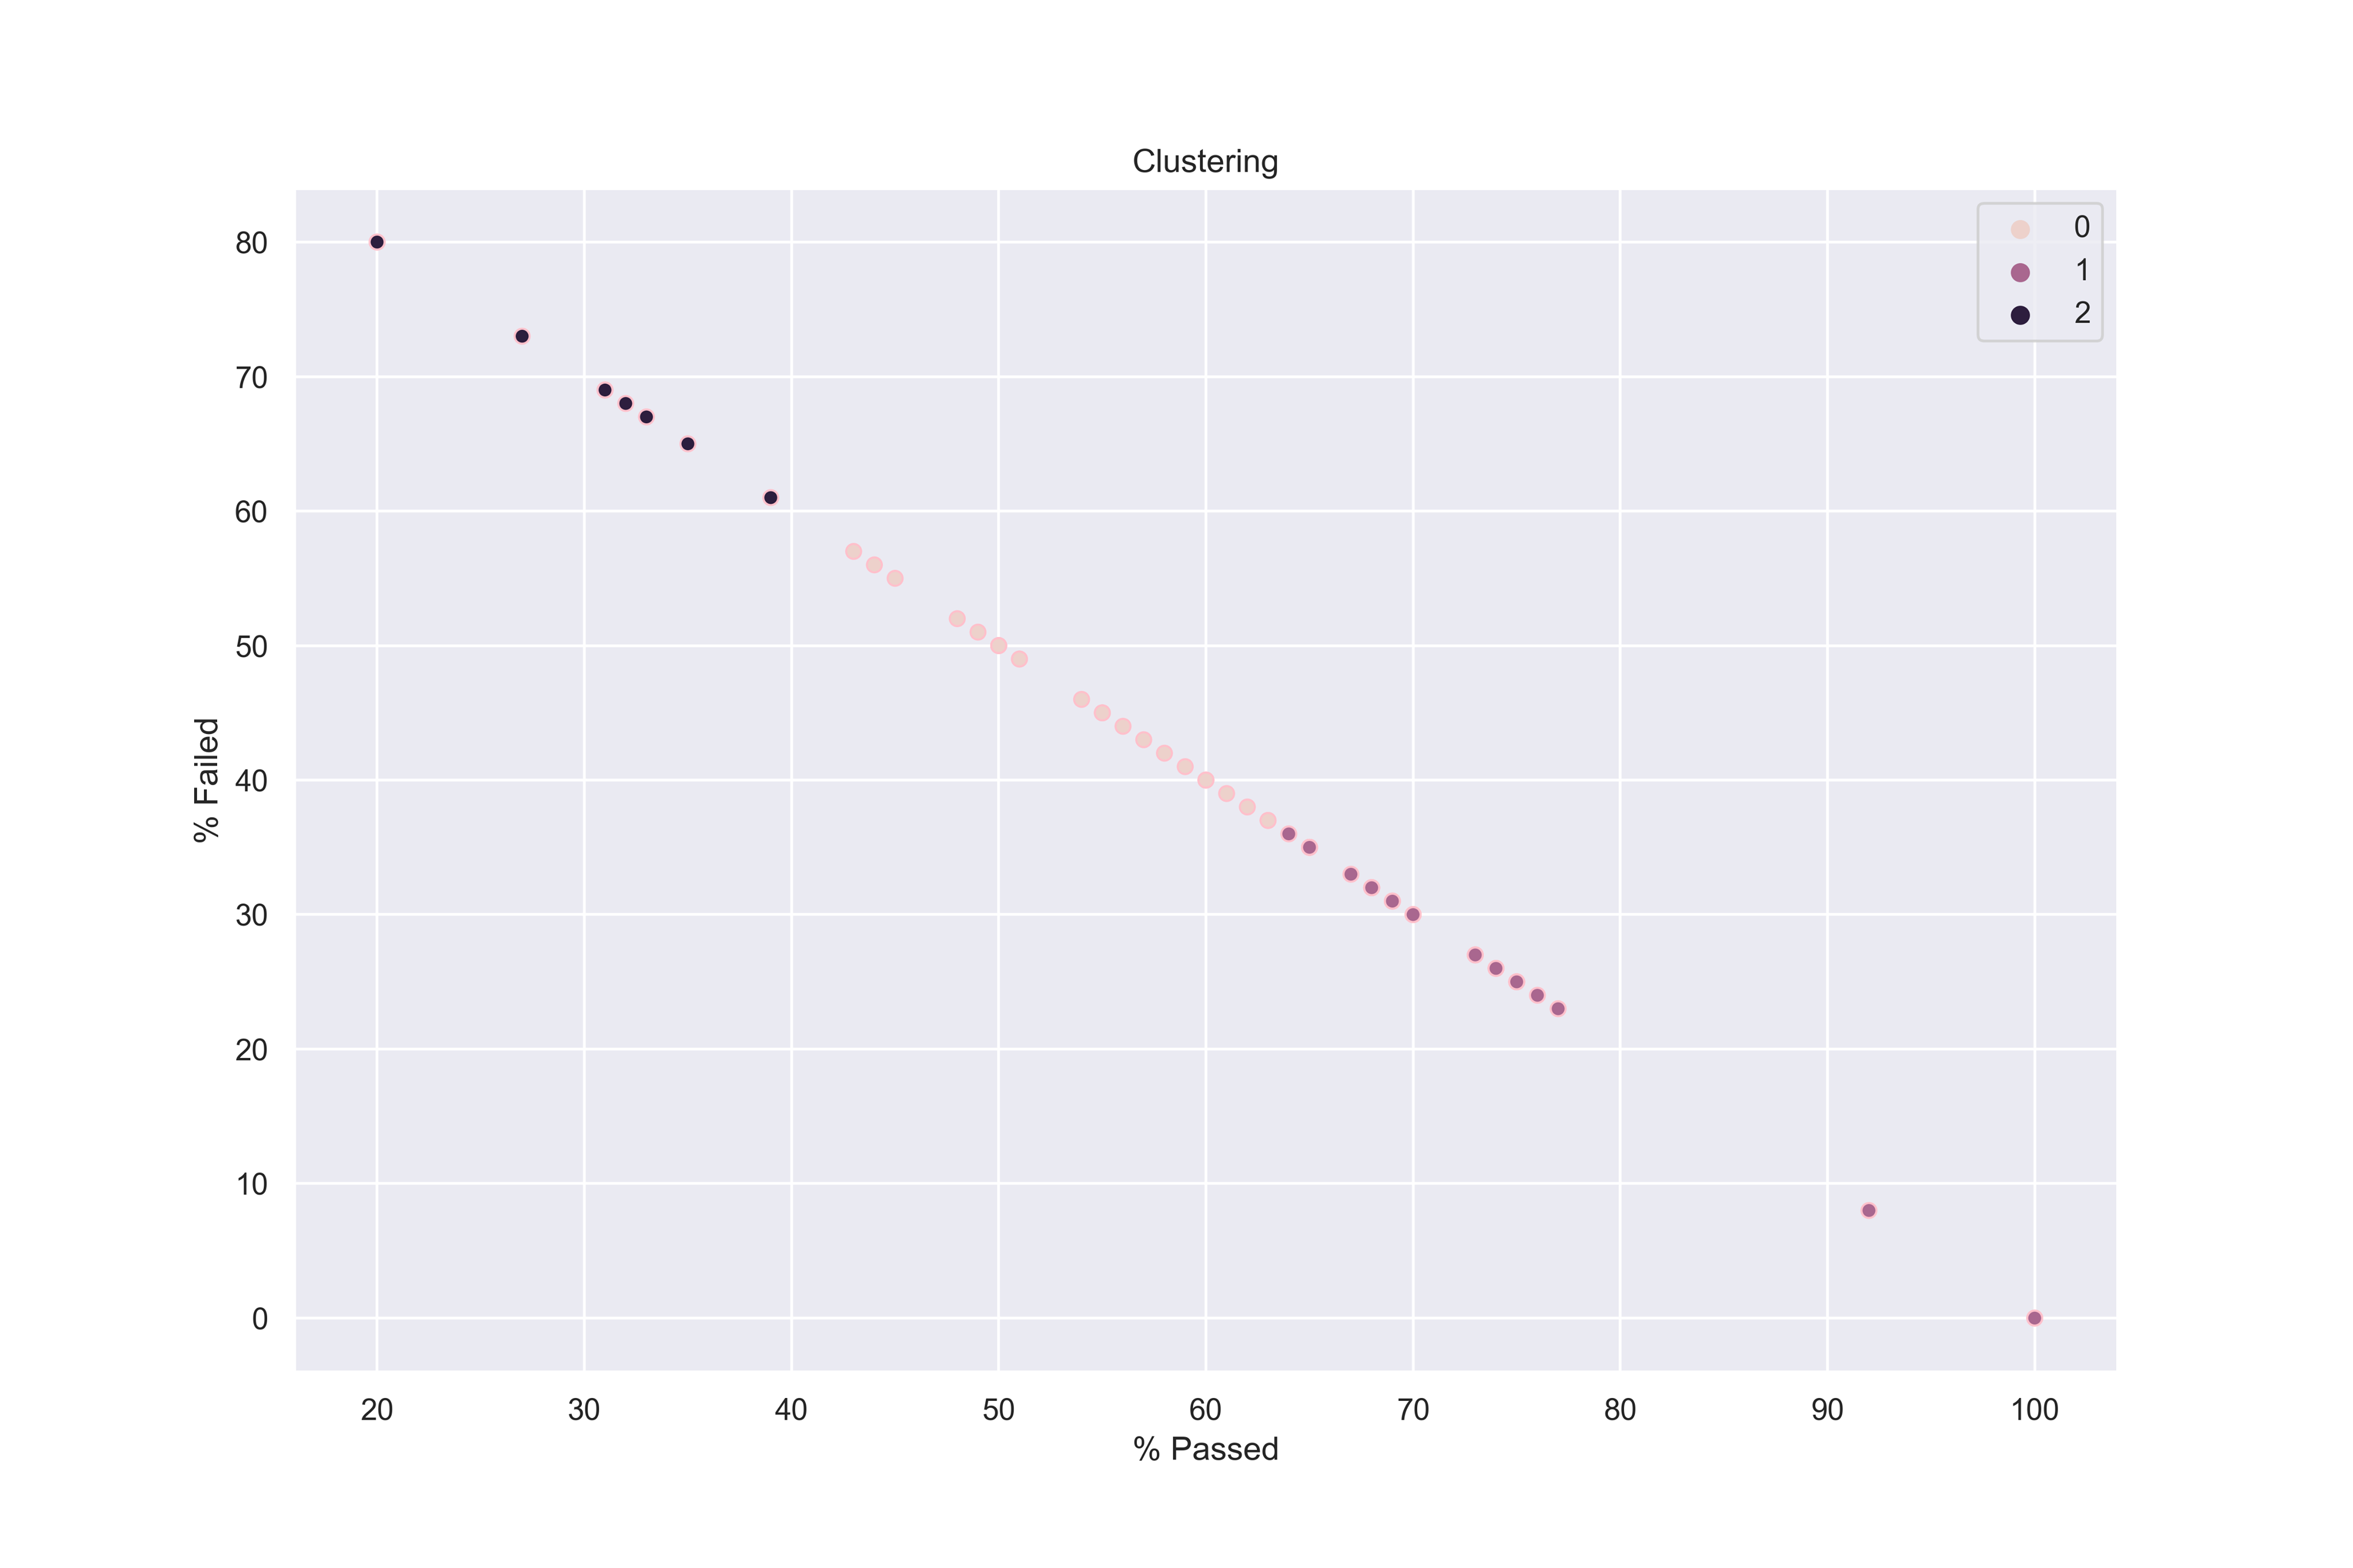
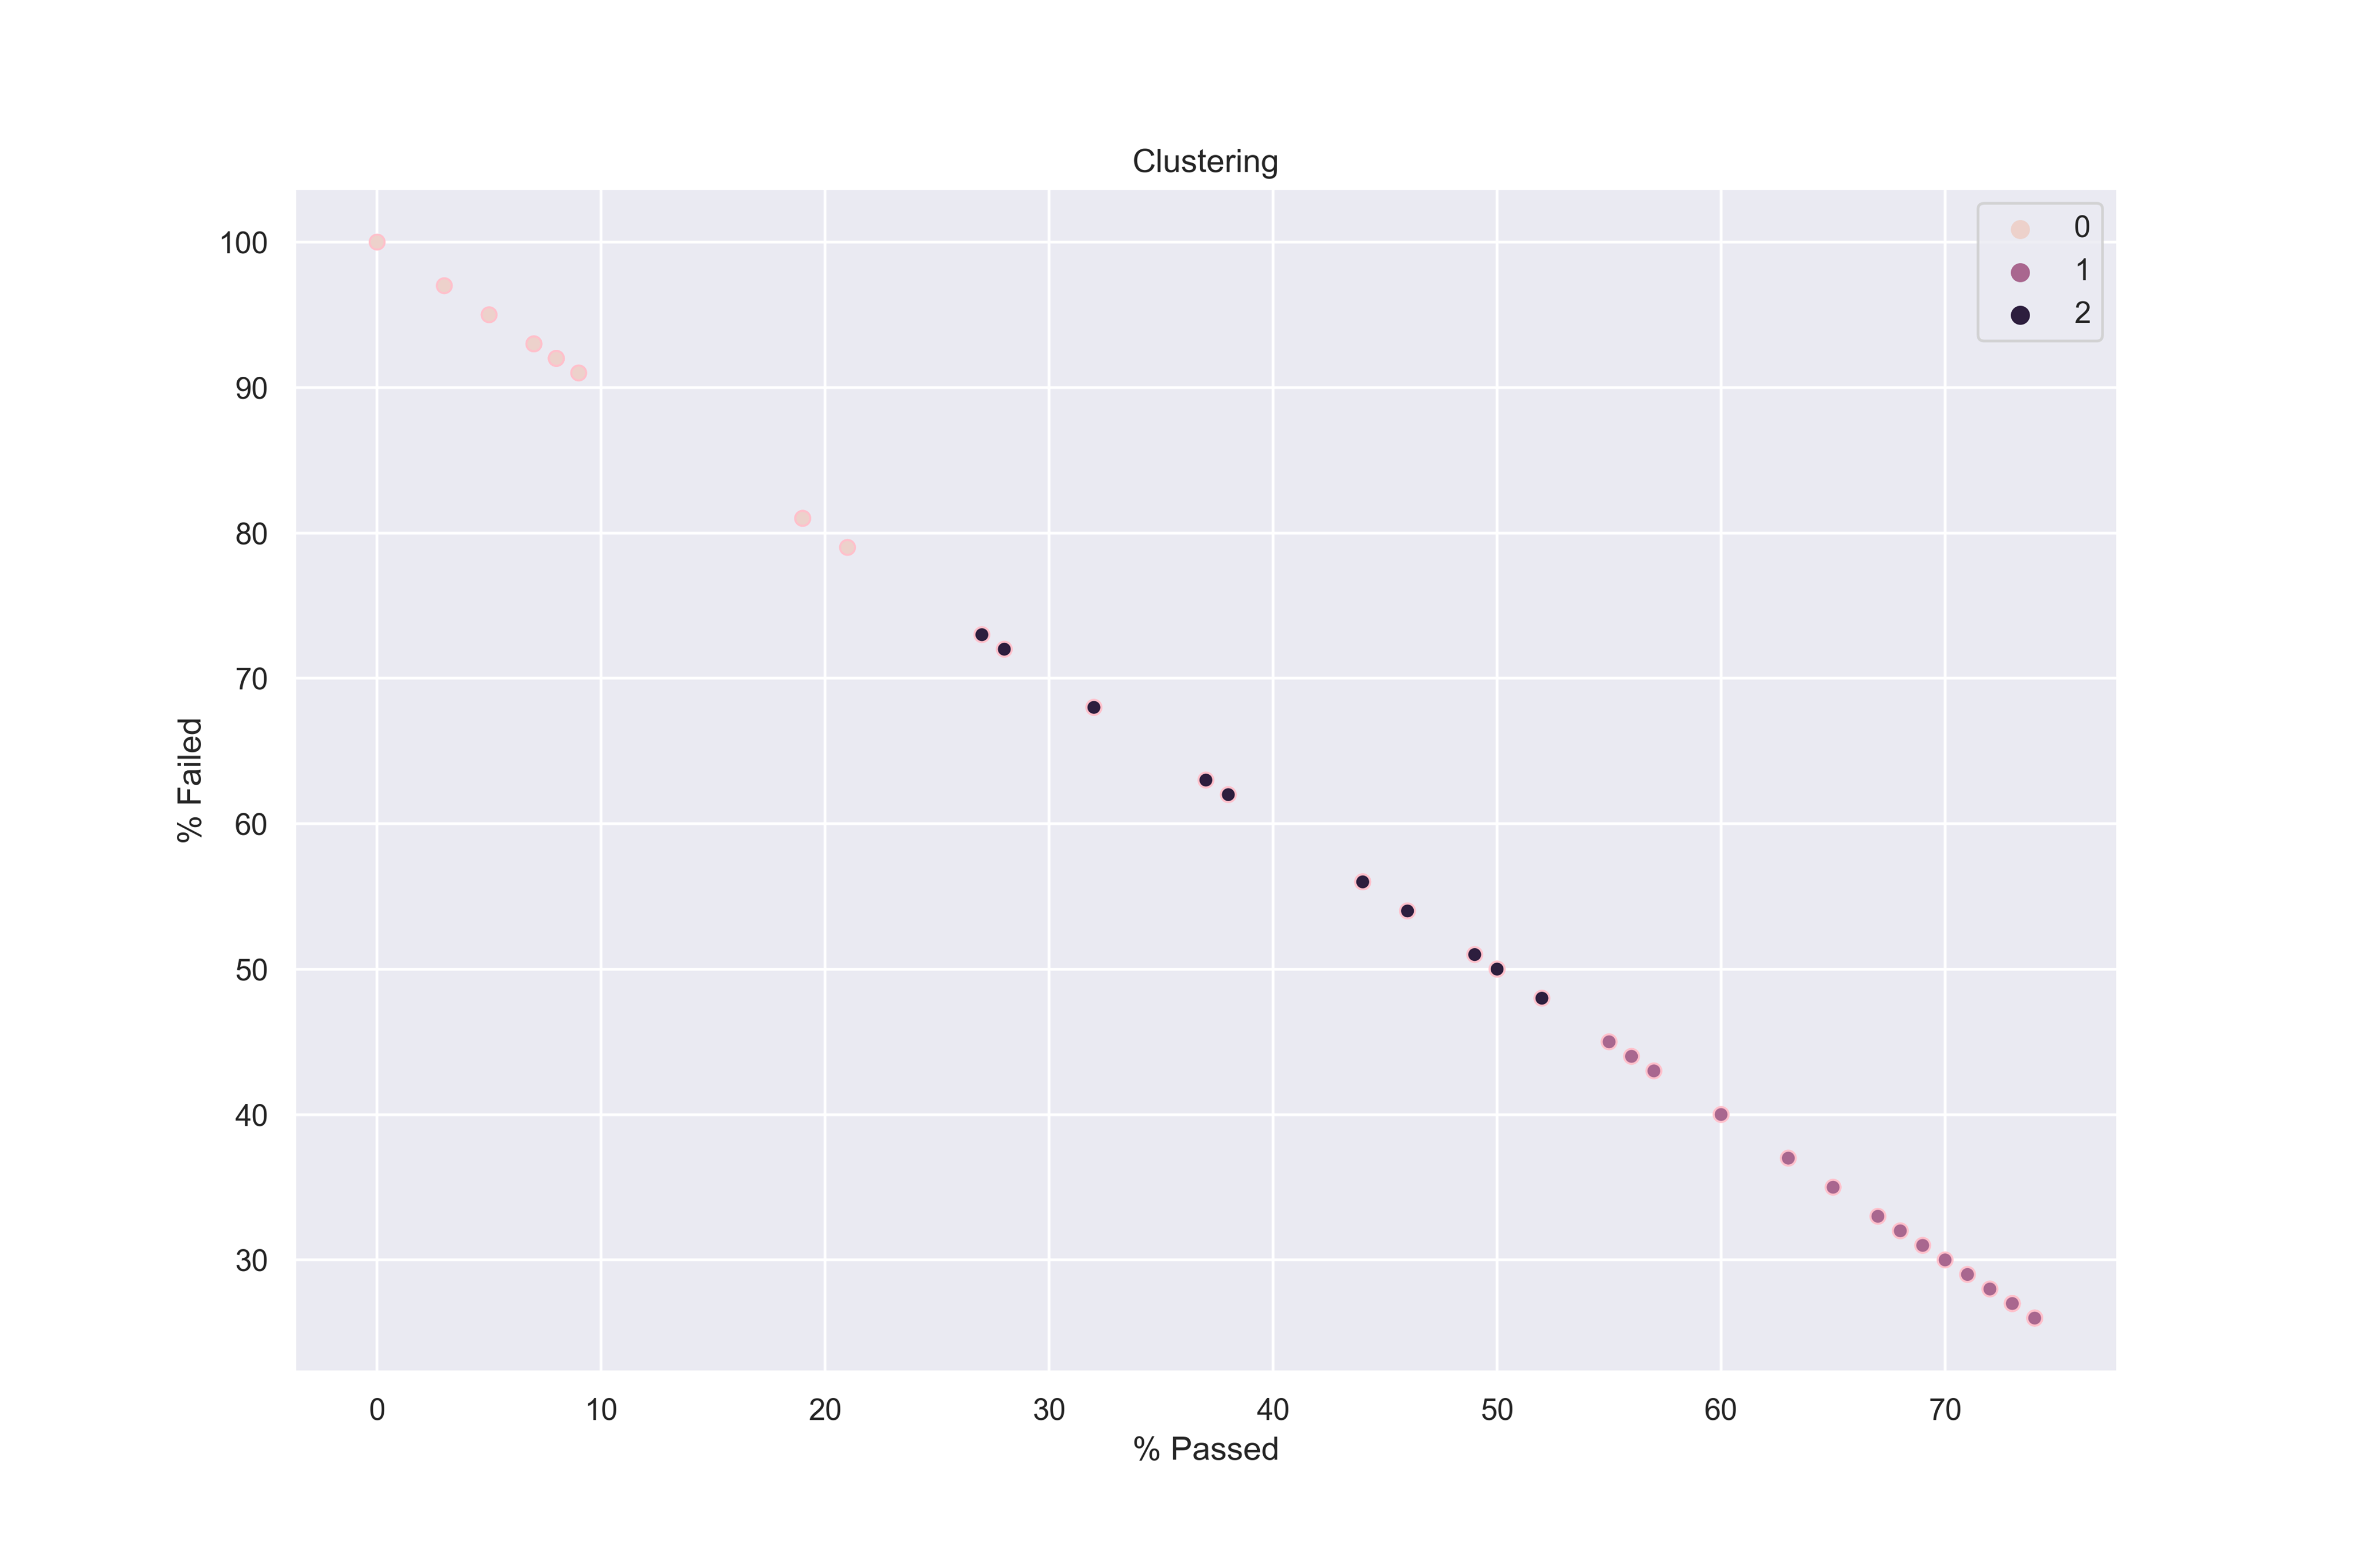
We applied a clustering method to our violations in order to see if we can highlight different categories of violations, from least to most severe. For this, we chose KMeans as clustering method. Moreover, because the violations changed on 01.07.2018, we had to separate our dataset into two different ones according to this date.

First, we performed clustering on the inspections performed up to 01.07.2018.

We identified 3 categories of violations based on the clustering done above:

Normal and minor violations
Those violations which do not concern food directly and are not a direct threat to people's health. They mostly concern:

  • The premises: floor, ceiling, ventilation, toilets.
  • Access to only authorized personnel in the food area.
  • Cleaning, the utensils, the different restrictions.

Severe violations
Those violations which have an important amount of failed and passed with conditions proportions as they can jeopardize people's health. They mostly concern:

  • The storage of the food: good temperature, thawing, labeling of the food.
  • Contamination issues: toxic elements are well stored, people with infections are kept away from the food area.
  • Hygienic practices.
  • Presence of a food manager on site.
  • Prohibition of reserving unwrapped food.
  • Smoking restrictions.

Critical violations
These violations seriously endanger customer's health and can be at the origin of food-related illnesses. They concern:

  • Food protection and storage: protection from rodents, food stored at the right temperature.
  • Rodent/insects/other animals infestation.
  • Handling of utensils and dishes: washed, rinsed and scraped.
  • Water sources: hot water, city pressure.

This clustering was realised based on the proportion of passed/failed/passed with conditions inspections. Our categories broadly match a classification we found on the city of Chicago website:

Our method to classify the violations (clustering by kNN) actually makes sense based on the website: minor violations have a small rate of fail and an important proportion of pass (our first cluster), severe violations have an important amount of passed with conditions (if a severe violation occurs, the facility gets a passed with conditions if this violation is corrected - this is our second cluster). Finally, the critical violations have a proportion of failed inspections above 70% - our third cluster. We applied the same type of clustering for the second part of the dataset containing the inspections following 7/1/2018:

For the second part of the dataset, the clustering is less obvious: we observed a serious decay in the proportion of passed violations. We tried to cluster the violations in 2, 3 and 4 clusters, but there is always a cluster containing only 2 violations. Therefore, we decided to stick with 2 clusters.
We identified the same patterns as before, the most critical violations include real dangers to the customers' health: the presence of rodents (38), handling of toxic substances (28), temperature control (33), water source (31), cooking conditions (34).

By shedding light on how the different violations can be classified in different categories (Minor, Severe and Critical), and how they contribute to the result of an inspection, we were able to use this information later on to build our models and perform meaningful feature extraction.


How are different risk levels localised across the map of Chicago?


As the data file contains the Latitude and Longitude for a large majority of the inspected facilities, we wanted to analyse the localisation of the different risk levels in relation to the average income per capita. To do so, we randomly sampled only 1000 establishments in order to be able to visualize them.


The map above shows that food establishments with low (green) and medium (orange) risk tend to somewhat cluster together (this would be more evident if we could plot all the establishments on the map). The various underlying shades of purple (visible if you zoom in) show the different average income per capita in the areas of Chicago. Thus, surprisingly, the average income per capita in the area is irrelevant when it comes to the prevalent food establishments' risks. Our original assumption was that richer areas will be host to more low risk facilities, but unfortunately they too have the problem of a high risk majority.


How do the inspections outcomes results vary over the years?


We also enquired whether there exist significant changes over the years in the distribution of inspections results.


A change in the results occurs between 2017 and 2018: less Pass and more Pass with conditions. It is linked to the change in the violations codes in July 2018, and the inspections seem to have also become stricter since then.


Are there any seasonal patterns affecting the inspections outcomes?


We then wondered if there exist seasonal patterns in our data, for instance, if we have a change in the proportion of Pass / Fail inspections during certain months of the year.


The plot above, even though simple, illustrates there is seasonality in the months of July, August and September. More precisely, during these months it seems that the average percentage of Pass inspections (over all years) decreases while the Fail increases. In retrospective, this is reasonable as the hot summer months tend to make it more difficult to store meat and other animal-derived ingredients, avoid rodents and insects, as well as maintain a comfortable temperature for the customers. Note that we considered both Pass and Pass w/ Conditions to be a Pass.

Overall, our analysis so far revealed that inspections seem to get stricter after 2017, with a higher proportion of Passed with conditions than Pass inspections. The main reason is that the violations codes changed in July 2018, thus implying a change in the way inspections are performed. If we take a look at the evolution of the results over the months, there is a clear increase in the Fail inspections proportion during summer: the risk of having temperature issues with the food, dysfunctional thermostats or infestations (rodents, insects) is higher. Since these violations usually make inspections fail, it is normal to observe this increase.
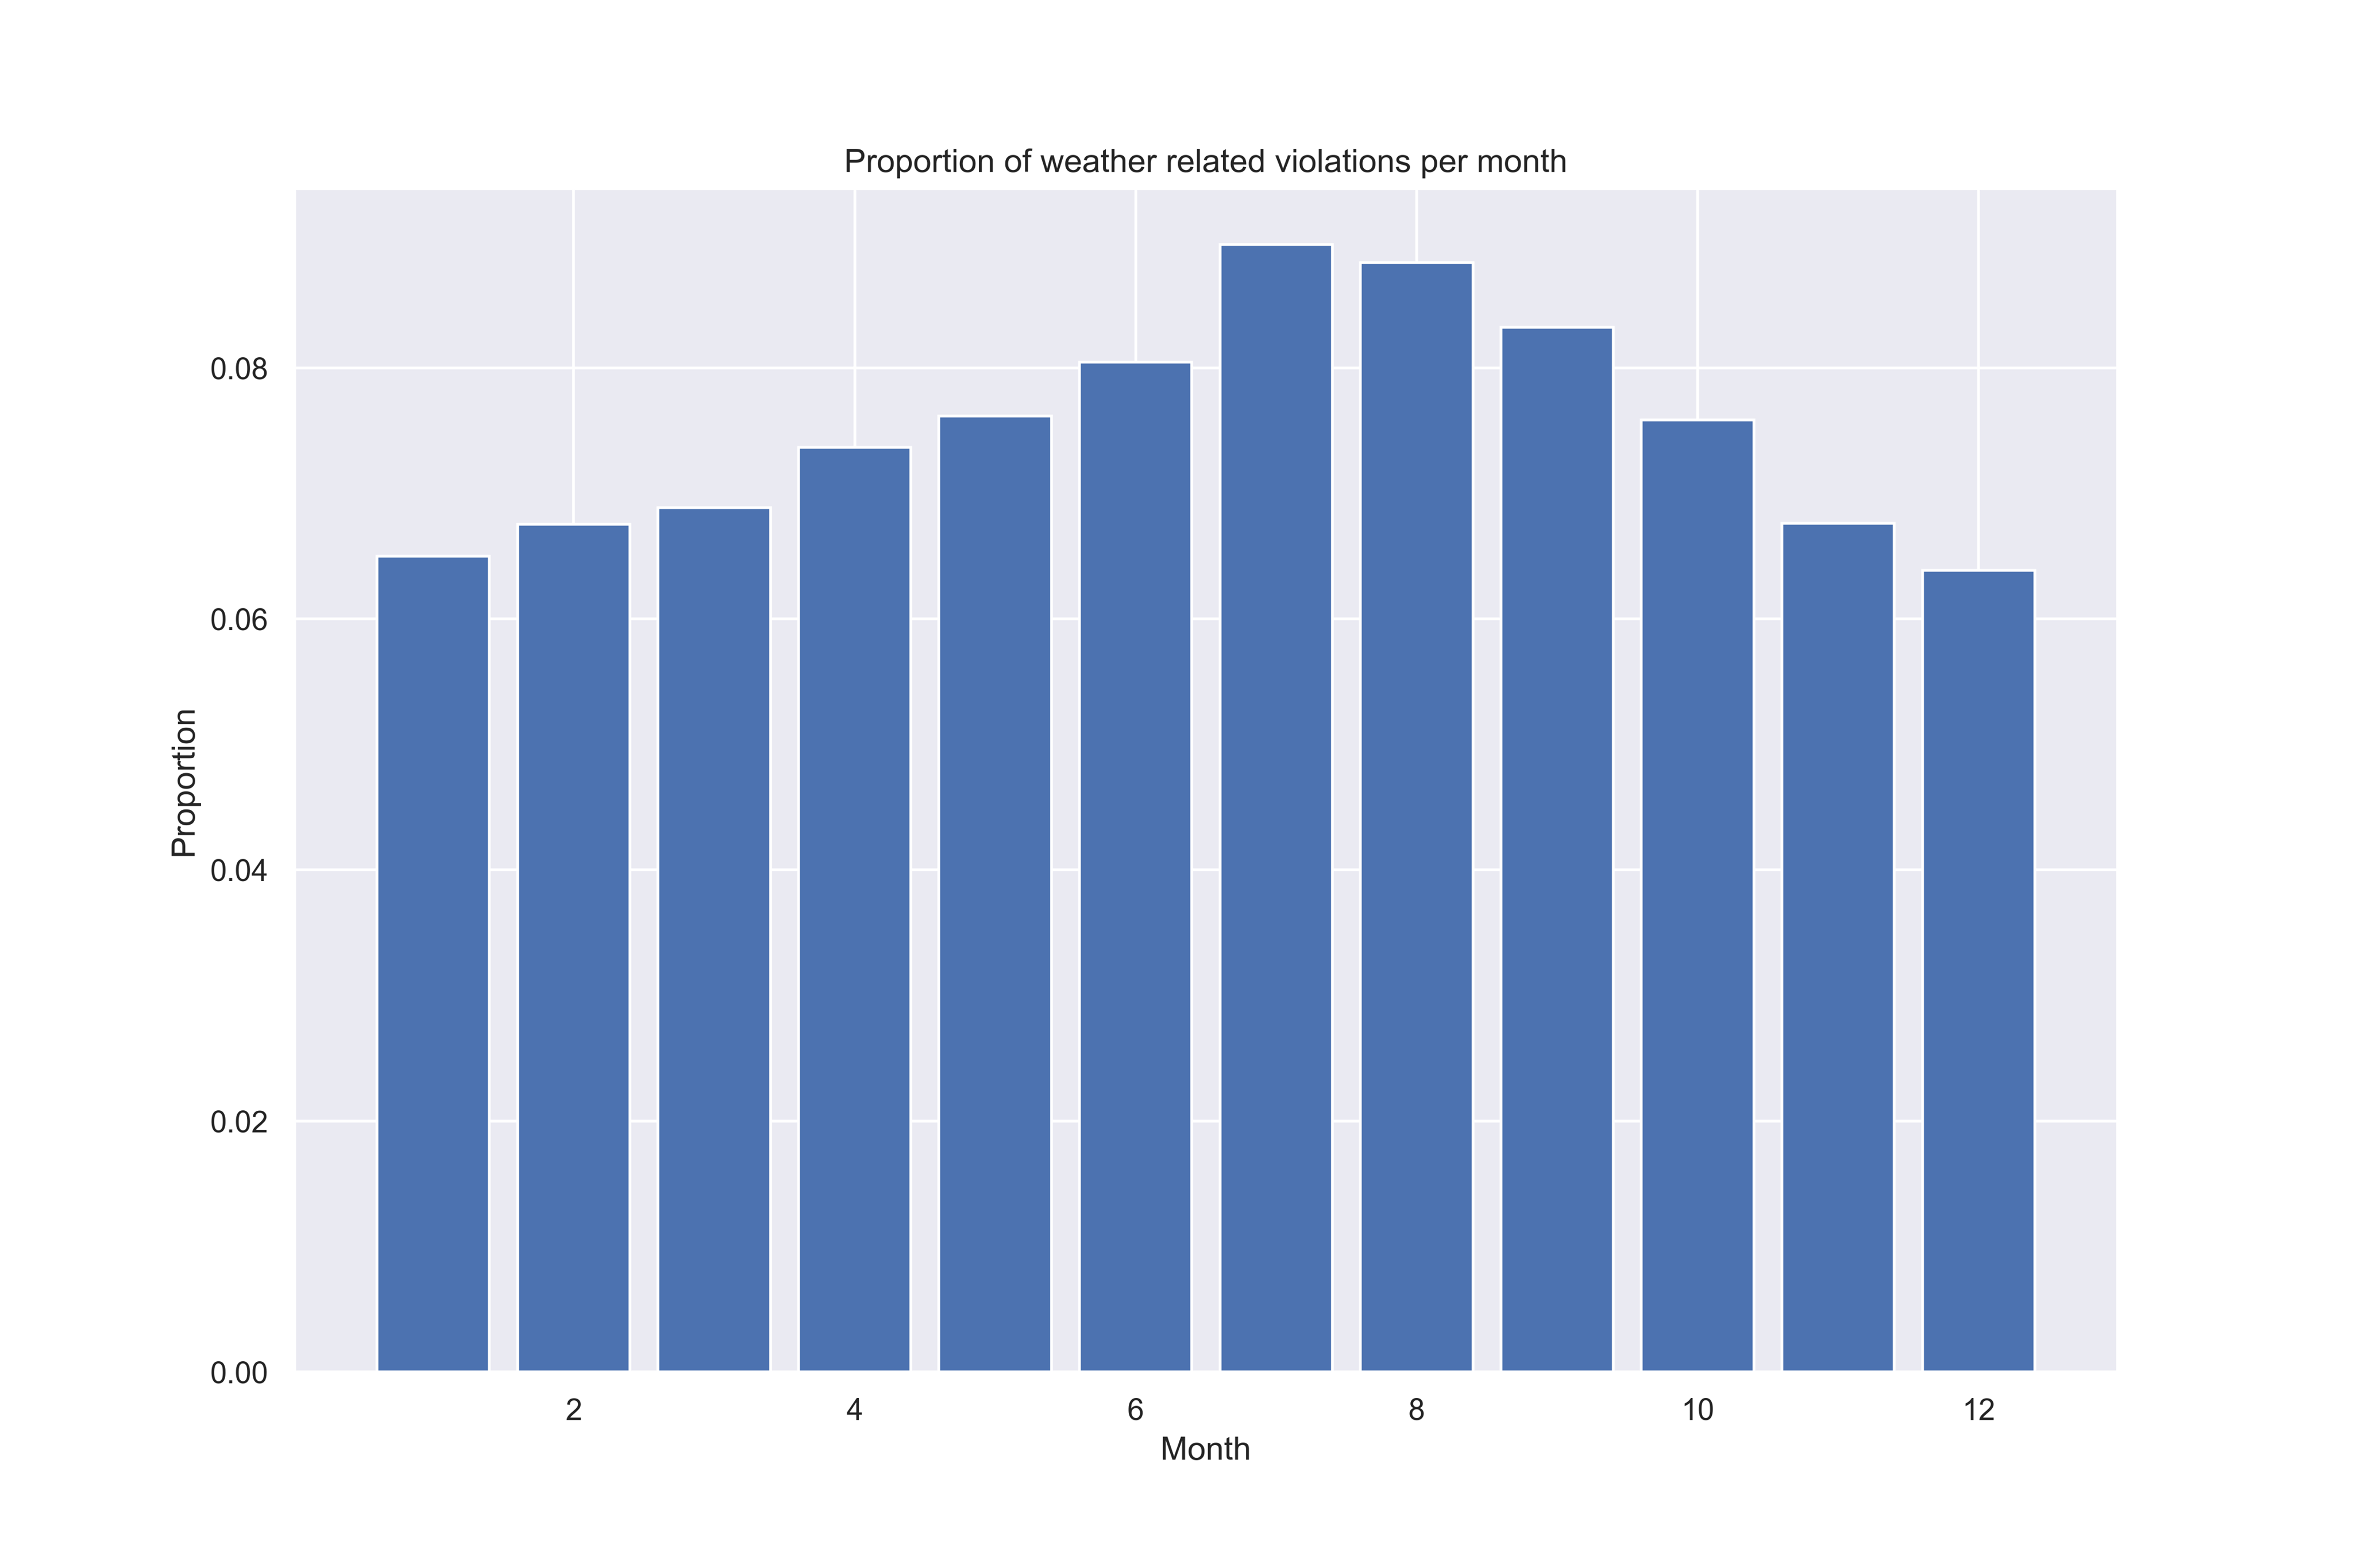
The weather-related violations are linked to: temperature, rodents, insects... By looking at the proportions of these critical violations per month, we can see again that their proportion is higher during summer, especially in August and July. Indeed, during summertime, establishments are more likely to encounter issues to preserve food at the right temperature, to keep it cold and to maintain adequate ventilation. Besides, heat can cause the proliferation of insects especially around garbage and the smell can drive rodents. This is why this is a period of time when inspectors need to watch out for this kind of violations. Moreover, this finding supports the above plot illustrating that more inspections tend to fail during the months of July, August and September.
Predictive Models


The final thing we tried to see was whether we can use the data we have in order to predict whether an inspection will pass or fail. We tried 4 different approaches for this problem, however, the main difference is not in the models we used, but in how we extract the features.

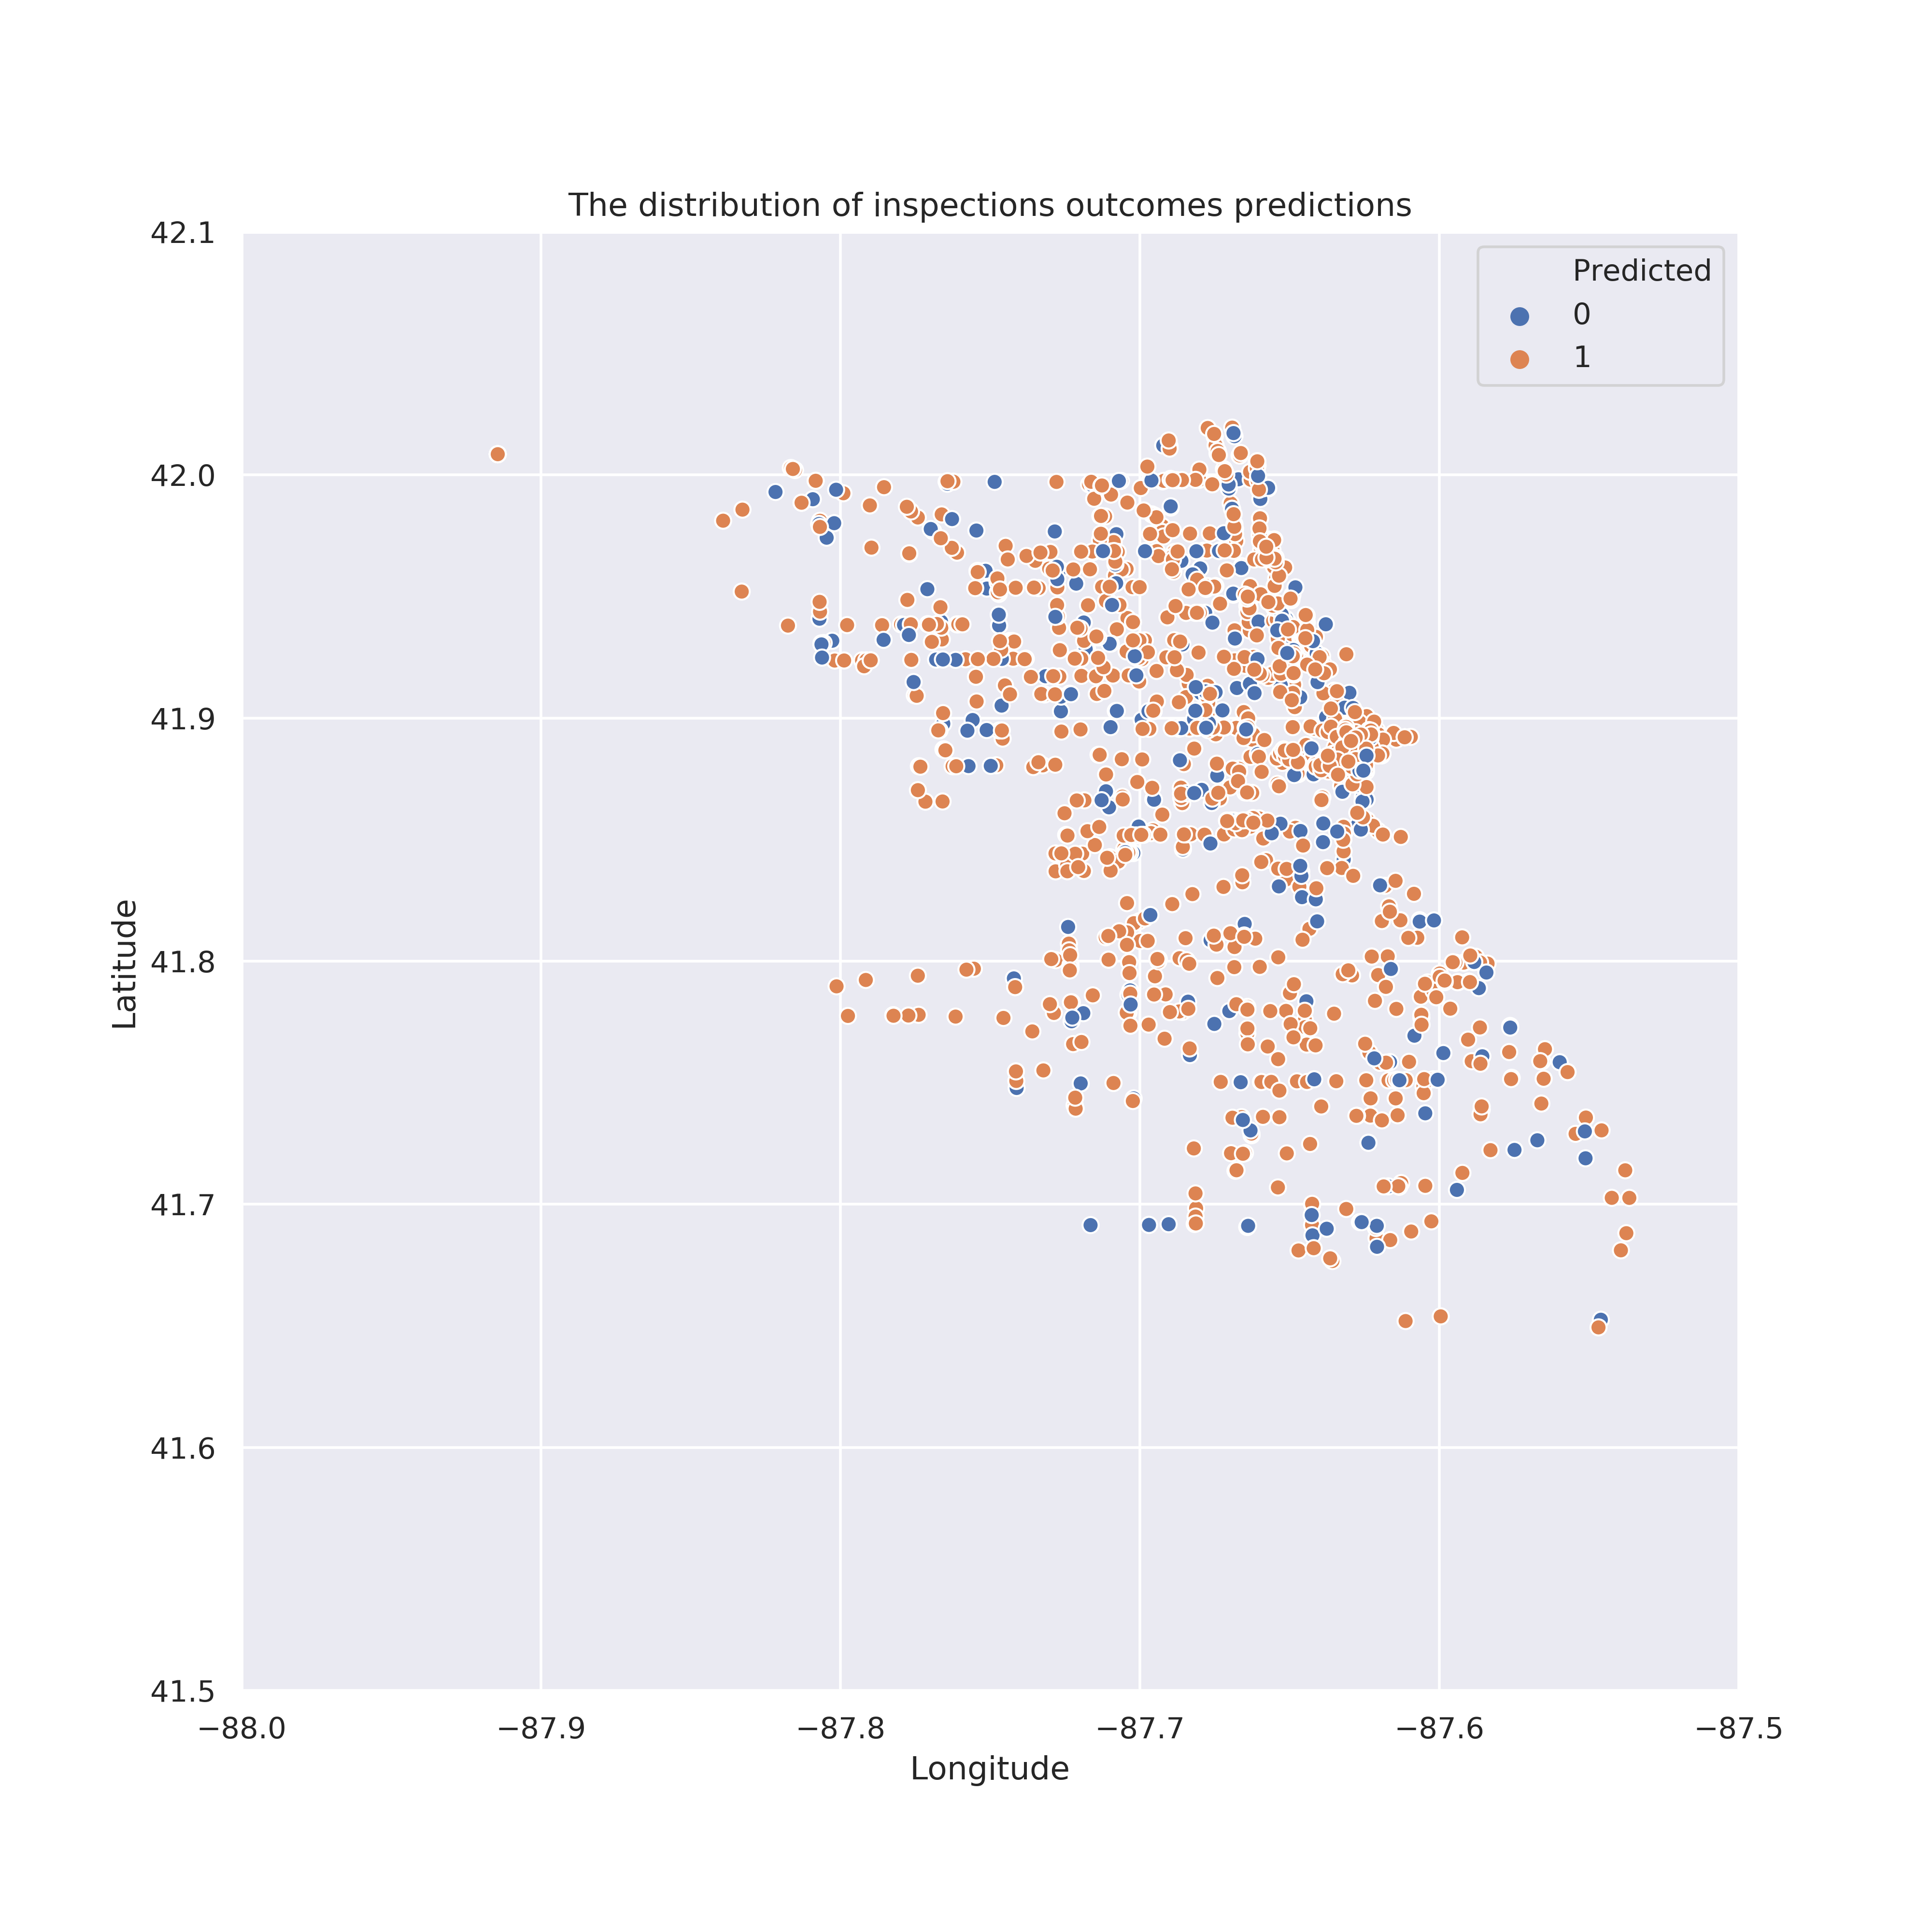
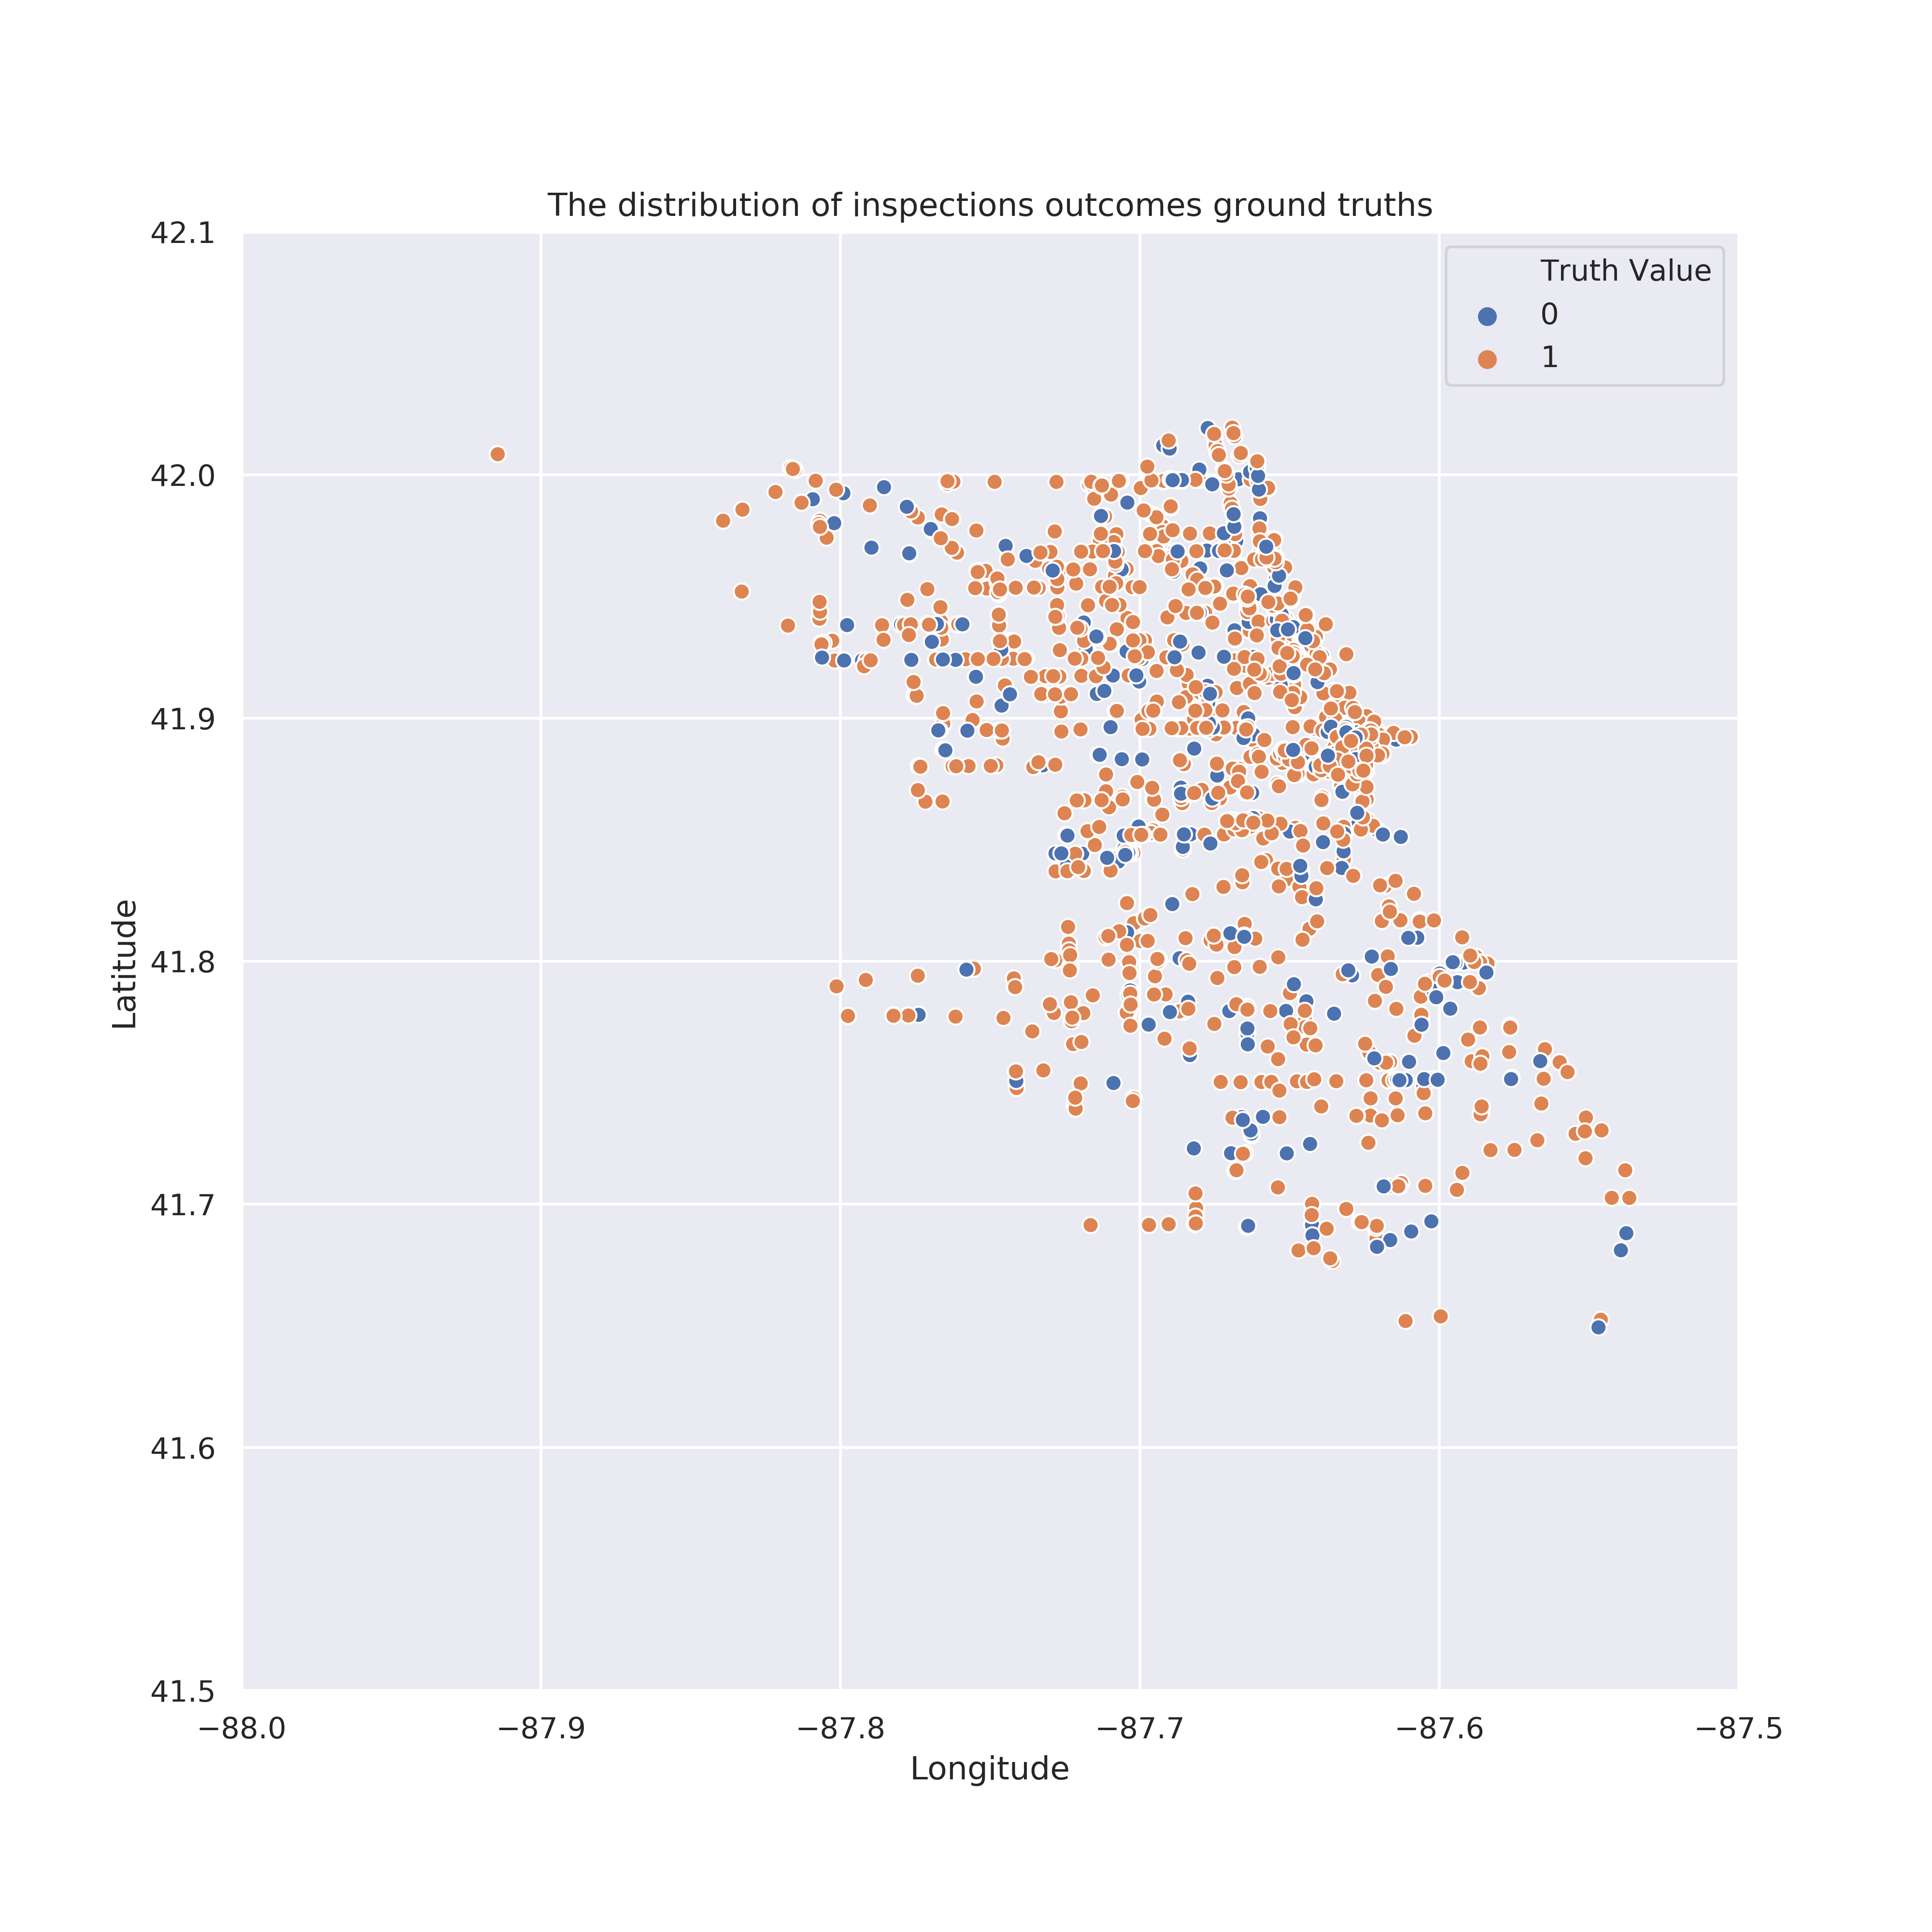
The approach which stood out is using 'Term Frequency - Inverse Document Frequency' (TF-IDF) vectorizer to extract important words as features from the violations and comments. This is particularly suited for our dataset because it is robust to the change in violations that occurred in 2018. By training a Linear Support Vector Machine with these features and performing grid search to find the optimal hyperparameters, we obtained a high test accuracy of 96% on a 40:60 test-train split of the original dataset. The following 2 maps illustrate a small subsample of the inspections.

The map on the left illustrates the outcomes predicted by the model on a small subsample of 1412 observations (where an accuracy of 98% was attained), while the map on the right shows the ground truth values. Note that the value 1 corresponds to a Pass and 0 corresponds to a Fail.


The following confusion matrix supports the results displayed above.


On the other hand, the other approaches we attempted provided really good results as well. The first one consisted in converting the violations to binary features: 1 column corresponds to one violation and the value contained is 1 if the violation is resent in the current inspection, 0 otherwise. The limitation of this approach is that it requires us to split the dataset and train 2 different models on the first split containing the old violations and on the new split containing the new violations after 2018. By training a Multilayer Perceptron on the first split of the data (old violations) we obtained a test accuracy of 94%.

The second approach is somewhat similar in the sense that, aside from using only the violations, it also uses other binary features like ‘Inspection Type’, ‘Facility Type’ and the Latitude and Longitude as numerical features. Once again the dataset has to be split and 2 different models have to be trained. By training a simple Logistic Regression on these features we obtained a test accuracy of 93%.

Last but not least, the final approach we used is also similar. The only difference is that we derive some new features to use together with the violations: the result of the previous inspection, the number of days since the last inspection and the number of violations. Once again we trained an MLP and obtained a test accuracy of 93%. This was obtained with multiclass labeling.

The conclusion we arrived at is that, in order to optimize a final predictive model, we should combine all the advantages of the previous models. Moreover, it is indeed possible to predict which food establishments are likely to fail an inspection. This is great news, given that our most important goal was to discover whether such predictive models can be trained on the Chicago Food Inspections data set in order to aid the relatively few inspectors to more effectively and efficiently locate the facilities that truly pose a threat to the Public Health.


Is it possible to generalise our model to other similar datasets from other cities?


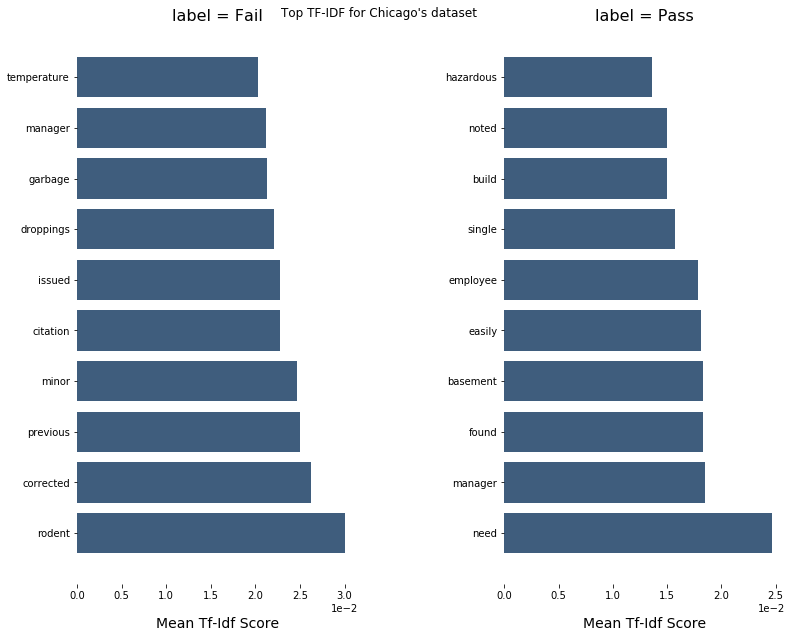
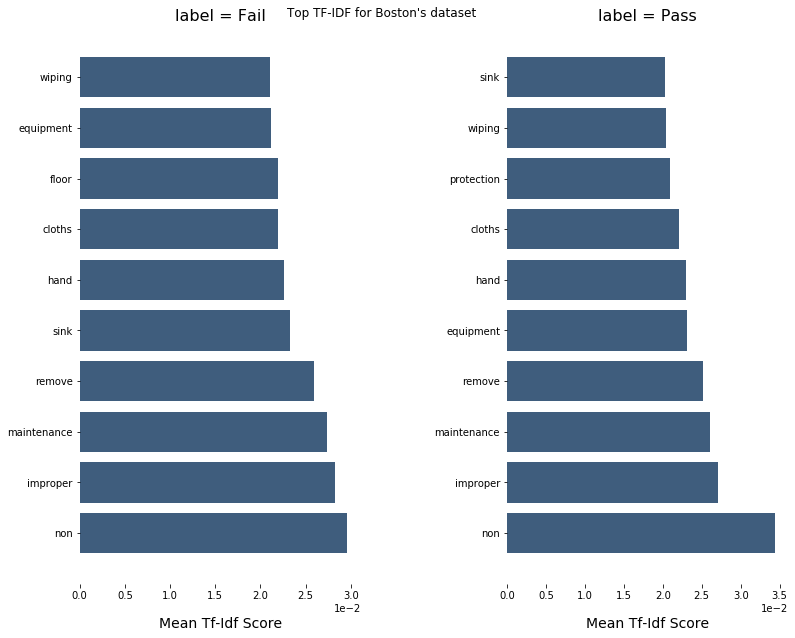
Since our model seemed to be working very well on the Chicago dataset, we decided to try to generalise it. For this, we picked a dataset that is similar to ours: Boston's food inspection. In this new dataset, we tested our model with the violation description and the inspector's comments. Unfortunately, it did not perform as expected. The overall accuracy achieved was around 44%. To figure out the reason behind this poor performance, we extracted and plotted the top 10 TF-IDF features for each class (Pass and Fail) for both Boston's and Chicago's dataset.


The first observation is that the features extracted from the two datasets are very different for the same class. This is one of the explanations behind the poor predictions. Another observation is regarding the two classes for the Boston dataset: the TF-IDF features are very similar. It seems like the comment section of this dataset doesn't have meaningful information regarding the outcome of the inspections. In conclusion, the generalisation of our model wouldn't work unless the inspections' comments (description of the violations) become more or less unified across cities.

How can we improve further the Chicago food inspections system?


In order to improve the existing inspection system, we thought it would be interesting to prioritize inspection. The food establishments that should be inspected first are the ones that are the more likely to have a critical violation. Indeed, critical violations include violations that may jeopardize the health of customers because they impede food safety. As a result, the establishments that should be inspected first are the ones which have the highest probability of having a critical violation based on their previous inspections. For now, 27% of the inspections are found to have a critical violation. By finding them earlier, we can improve the system and maybe prevent them from happening.


To prioritize inspections, one feature that could help our prediction model is to determine if an establishment previously had critical violations and more generally, the category of its previous violations. For now, the clustering is divided into 3 categories before the change in violations and 2 categories after which might have a negative effect on the model. In order to have the same number of categories before and after the change in violations, we need to change a bit the existing clustering. One way to obtain 3 categories is to map Pass and Pass w/conditions together.

The critical violations identified have a high percentage of failed inspections and a low one of successful inspections. Besides, they are associated with factors that can endanger customers.

    Here are the features included in our model to predict critical violations:
  • Number of critical/serious/normal violations last time
  • Result of the last inspection
  • Number of violations last time
  • Number of days since the last inspection
  • Risk last time
  • Number of days the establishment has been operating


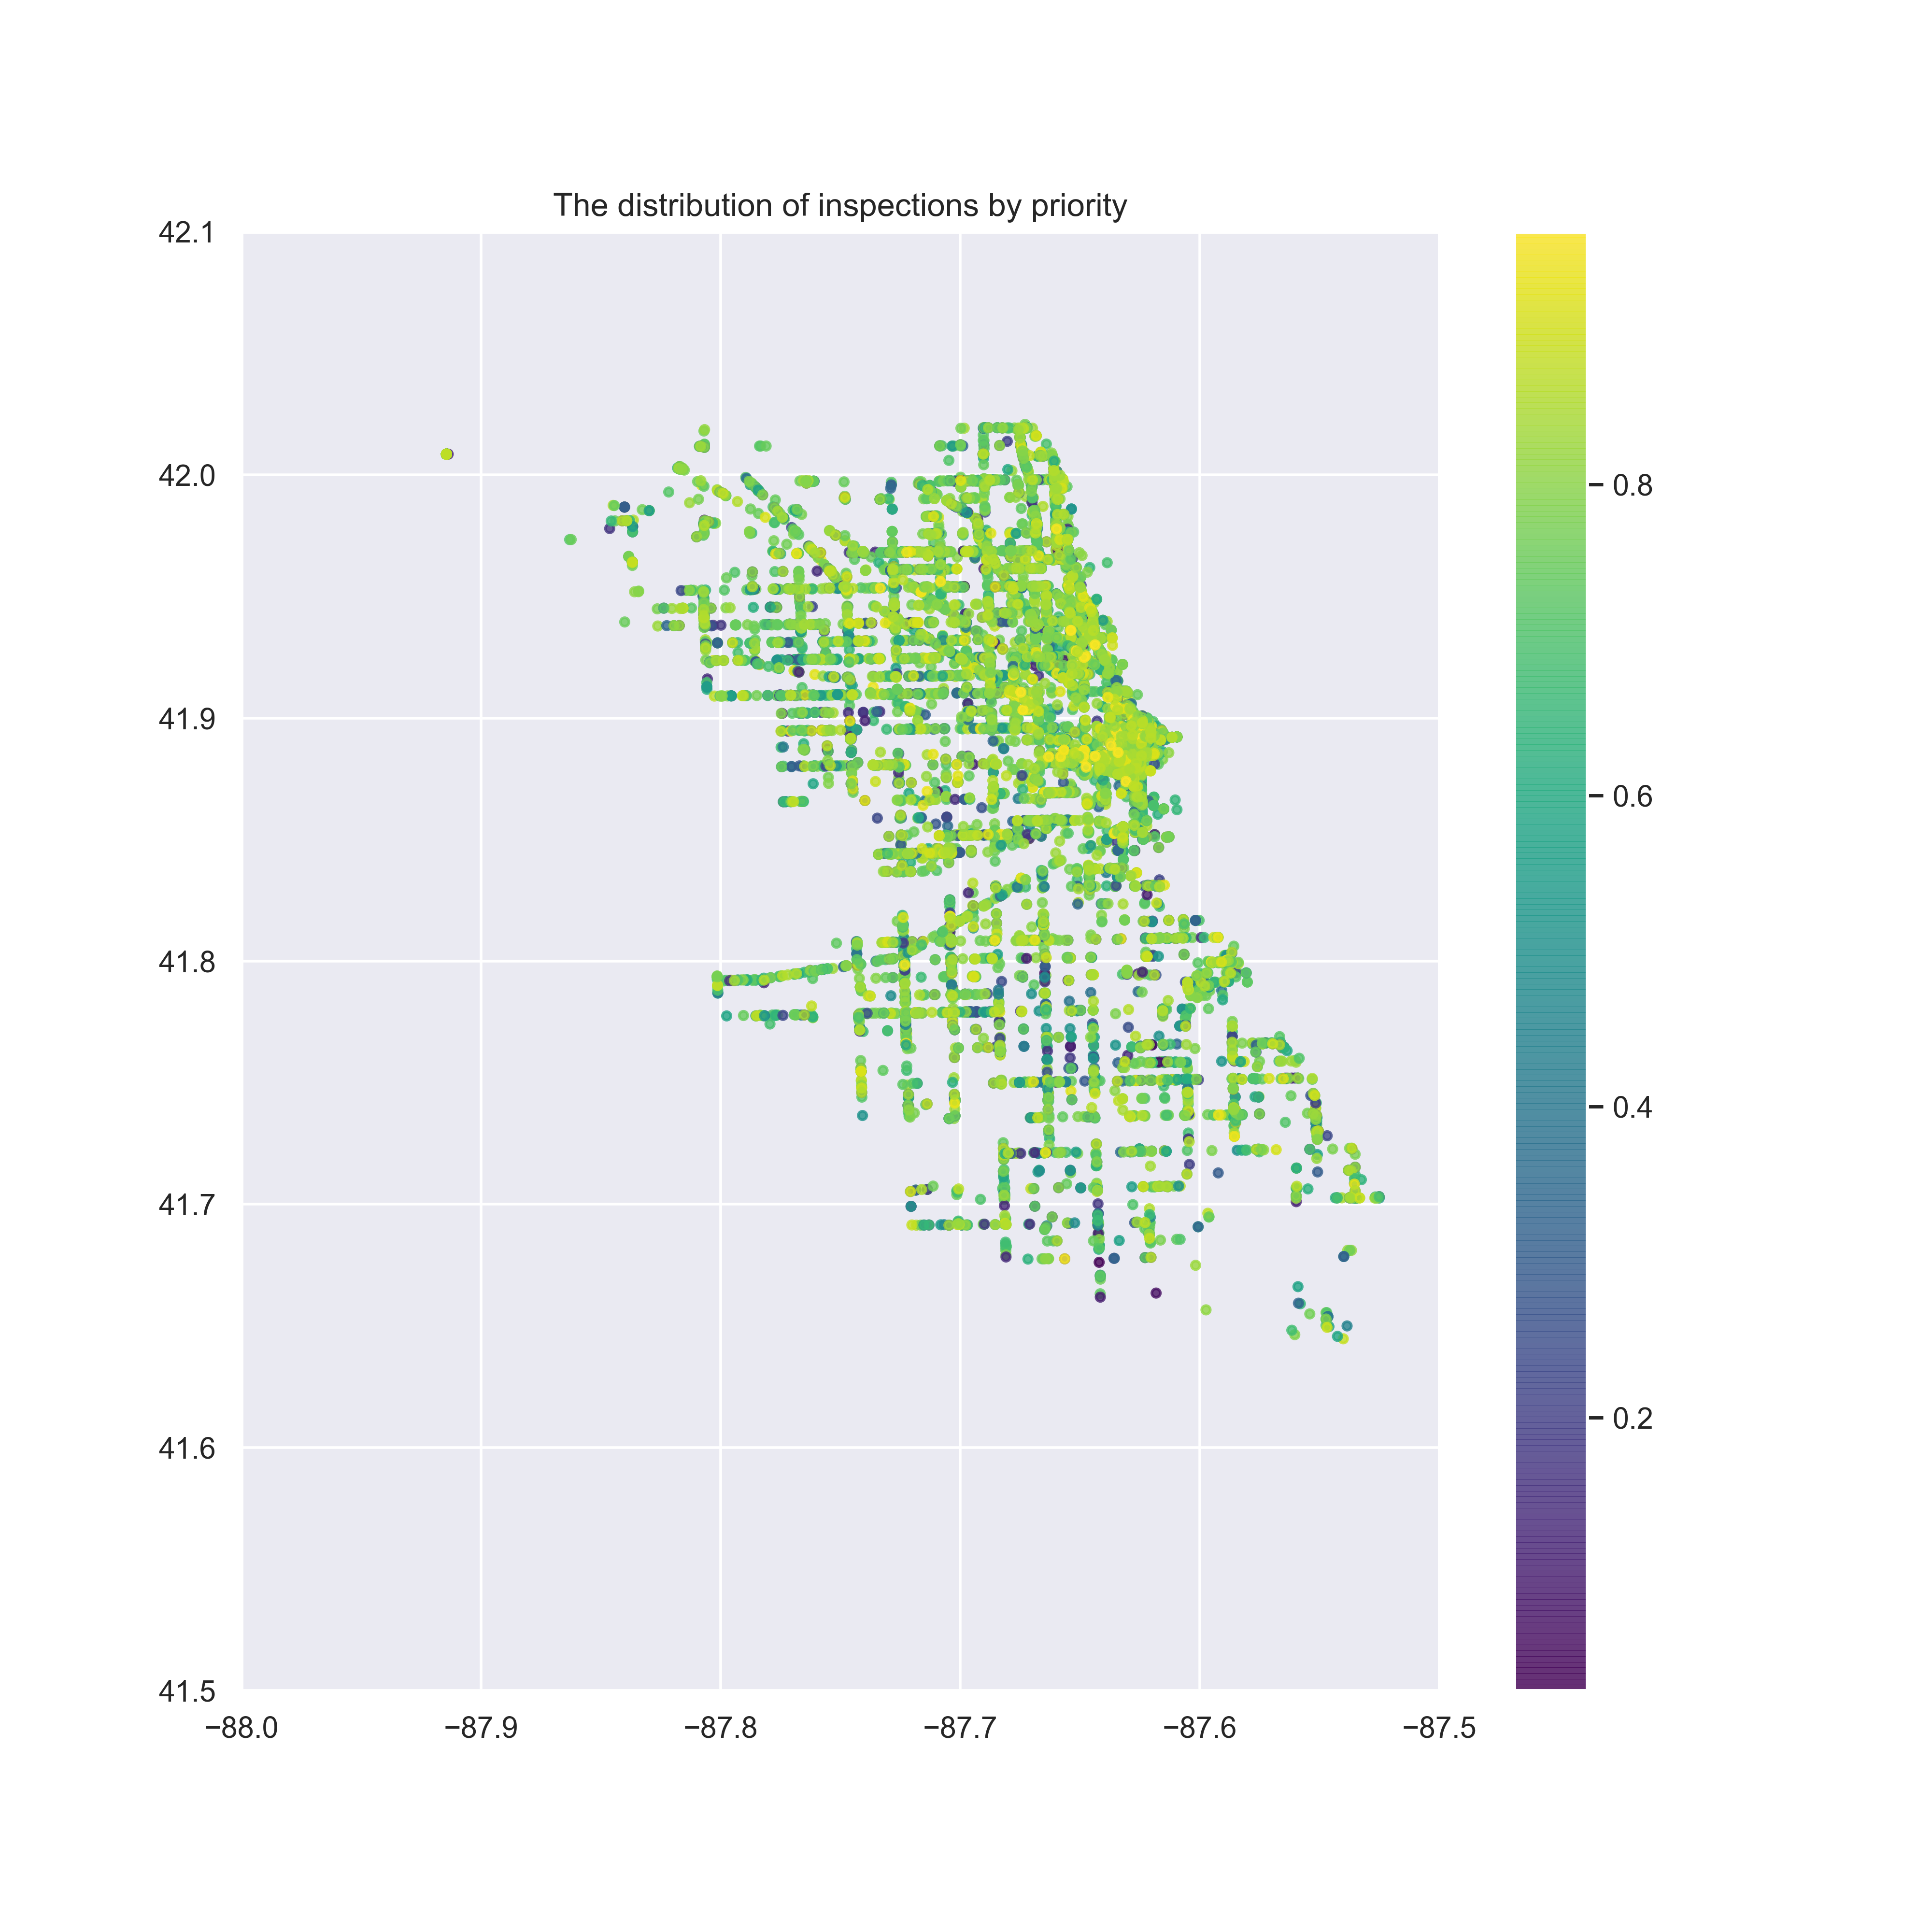
Our model has a 77% accuracy. We can create a function which predicts which establishments are to be inspected first at a given date based on their probability of having a critical violation. The above plot is an example for a random date. The yellow dots correspond to the establishments that need to be inspected in priority whereas as we go towards more violet points, we can assume that these establishments can be inspected later since they are less likely to get a critical violation.

Limitations

Given the nature of our dataset, we encountered several limitations:

  • The risk values are categorical, hence we had to map them to ordinal values. For this reason, the values we worked with during analysis might not be as accurate as we would wish them to be.
  • Due to the change in violations that occured in July 2018, we had to split the dataset into 2 unbalanced ones (the one following the change is much smaller) to perform certain analysis on the violations, as well as to train some of our models. Hence, the results might yet again not be as accurate as we would wish them to be.
  • The dataset contains a large number of entries and thus it is impossible to visualize all of them on the map.