Data Story
We are focused on identifying those factors that affect and can be used to predict which food establishments may be at risk of spreading foodborne illness. This advanced analysis can aid the relatively small number of inspectors to target efficiently and effectively the occurrence of critical violations, a task which is a top Public Health priority.
What is the proportion of high risk food establishments?
Surprisingly, most facilities are high risk establishments and very few of them are low risk ones. The proportion of medium risk establishments is also fairly low. This finding supports further the need for advanced analysis and predictive methods for identifying the most dangerous facilities, as it is highly difficult to pinpoint them among a majority of high risk establishments.
What are the most inspected facility types?
It seems that restaurants, grocery stores and schools are the most inspected facility types.
What is the most frequent inspection type?
The most common type of inspection is Canvass which is performed at a frequency relative to the risk of the establishment as explained in the Inspection type column description. The second most common type of inspection is Complain and it should be interesting to know if these types of inspection are more likely to fail. License inspections are also frequent, done as a requirement for the establishment in order to receive its license to operate since many new food establishments open up in Chicago each year. Finally, inspections for Suspected Food Poisoning (in response to one or more persons claiming to have gotten ill as a result of eating at the establishment), Tag-Removal inspections (inspection of a bar or tavern) and Consultation (when the inspection is done at the request of the owner prior to the opening of the establishment) do not occur really often. Moreover, Re-Inspections can occur for most types of inspections and are indicated as such.
What proportion of the inspections pass?
Despite the concerning number of high risk food establishments, most of them pass the inspections. This might lead us to conclude that both the situation is not as grim as it seems at a first look, but also that it takes a long period of time until the inspectors come across the facilities that are a critical threat to the Public Health.
The results obtained so far also showed us that, although most food establishments are categorised as having High Risk, a much larger proportion of the inspections pass rather than fail. To make matters worse, it seems that most inspections are of type Canvass or License, and only a small percentage is based on complaints which means that the consumers are unaware of the standards the establishments should meet, their own safety or, even worse, the establishments themselves hide their issues very well.
How safe is your favourite chain restaurant/fast-food?
We thought it would be interesting to obtain more insights on chain restaurants/fast-foods inspections since these establishments are supposed to run by stricter rules and to be particularly careful regarding their inspections since a bad report could jeopardize the whole chain. We first decided to select the top 9 chain restaurants. In order to do so, we selected the restaurants which have more than 20 establishments under the same DBA name across the city. We then plotted the evolution of the mean risk throughout the years.
Surprisingly, although 4 out of the top 9 chain restaurants have medium risk, the other 5 have a high risk and none have a low risk. However, having a high risk doesn't mean that the inspection will fail. So next we decided to look more into how the number of violations influences the result of an inspection.
Surprisingly, although 4 out of the top 9 chain restaurants have medium risk, the other 5 have a high risk and none have a low risk. However, having a high risk doesn't mean that the inspection will fail. So next we decided to look more into how the number of violations influences the result of an inspection.
What is the effect of the number of violations on the inspection's outcome?
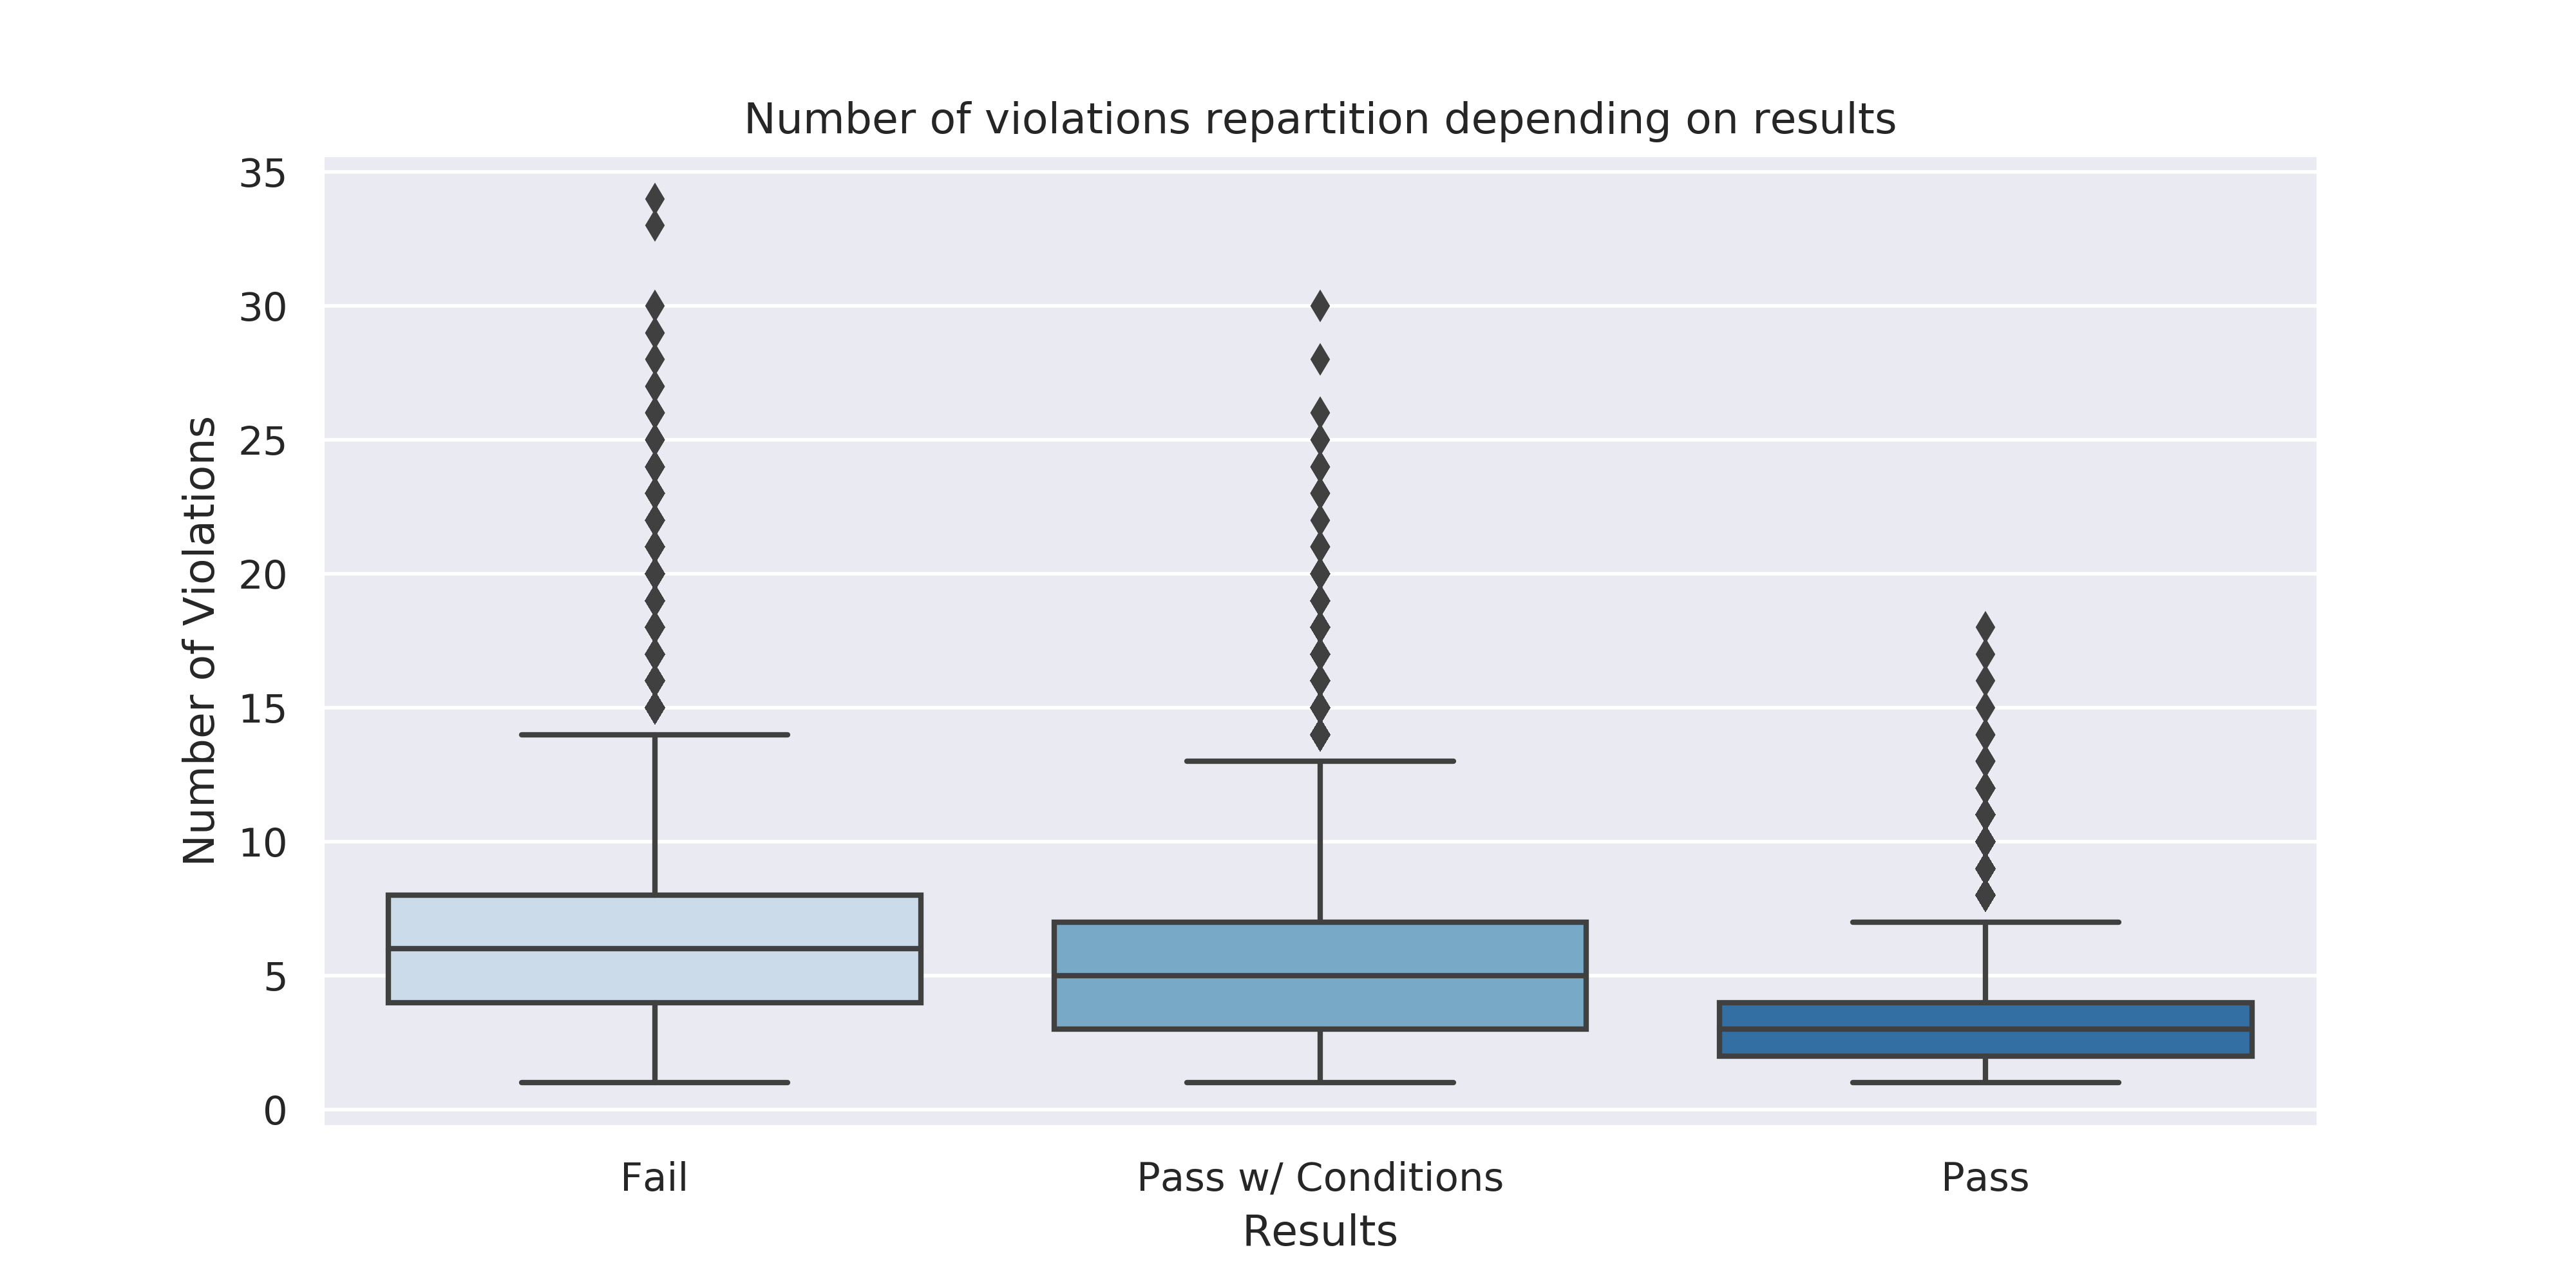
For the dataset, we only look at the 3 most relevant categories regarding the Results: Fail, Pass and Pass with conditions. We plotted the boxplots corresponding to those 3 categories representing the number of violations. Unsurprisingly, the failed inspections were the ones with the most violations. An establishment with more violations is thus most likely to fail the inspection.
Nevertheless, we can observe some outliers on the boxplots: some facilities with a high number of violations still passed the inspection. One explanation for this is that some violations are more critical than others and are more likely to make an inspection fail. Furthermore, the result is determined by a combination of several violations, and not by the cumulated independent effect of each violation. Finally, the severity of a violation varies from an inspection to another: one facility may have not fulfilled several aspects of the violation.
Nevertheless, we can observe some outliers on the boxplots: some facilities with a high number of violations still passed the inspection. One explanation for this is that some violations are more critical than others and are more likely to make an inspection fail. Furthermore, the result is determined by a combination of several violations, and not by the cumulated independent effect of each violation. Finally, the severity of a violation varies from an inspection to another: one facility may have not fulfilled several aspects of the violation.
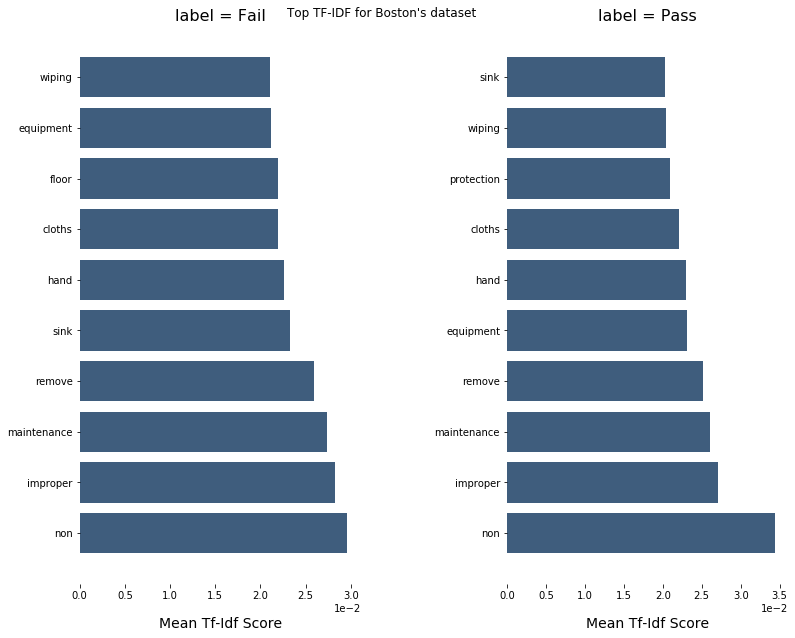
What are the differences between violations in terms of severity?
We applied a clustering method to our violations in order to see if we can highlight different categories of violations, from least to most severe. For this, we chose KMeans as clustering method. Moreover, because the violations changed on 01.07.2018, we had to separate our dataset into two different ones according to this date.
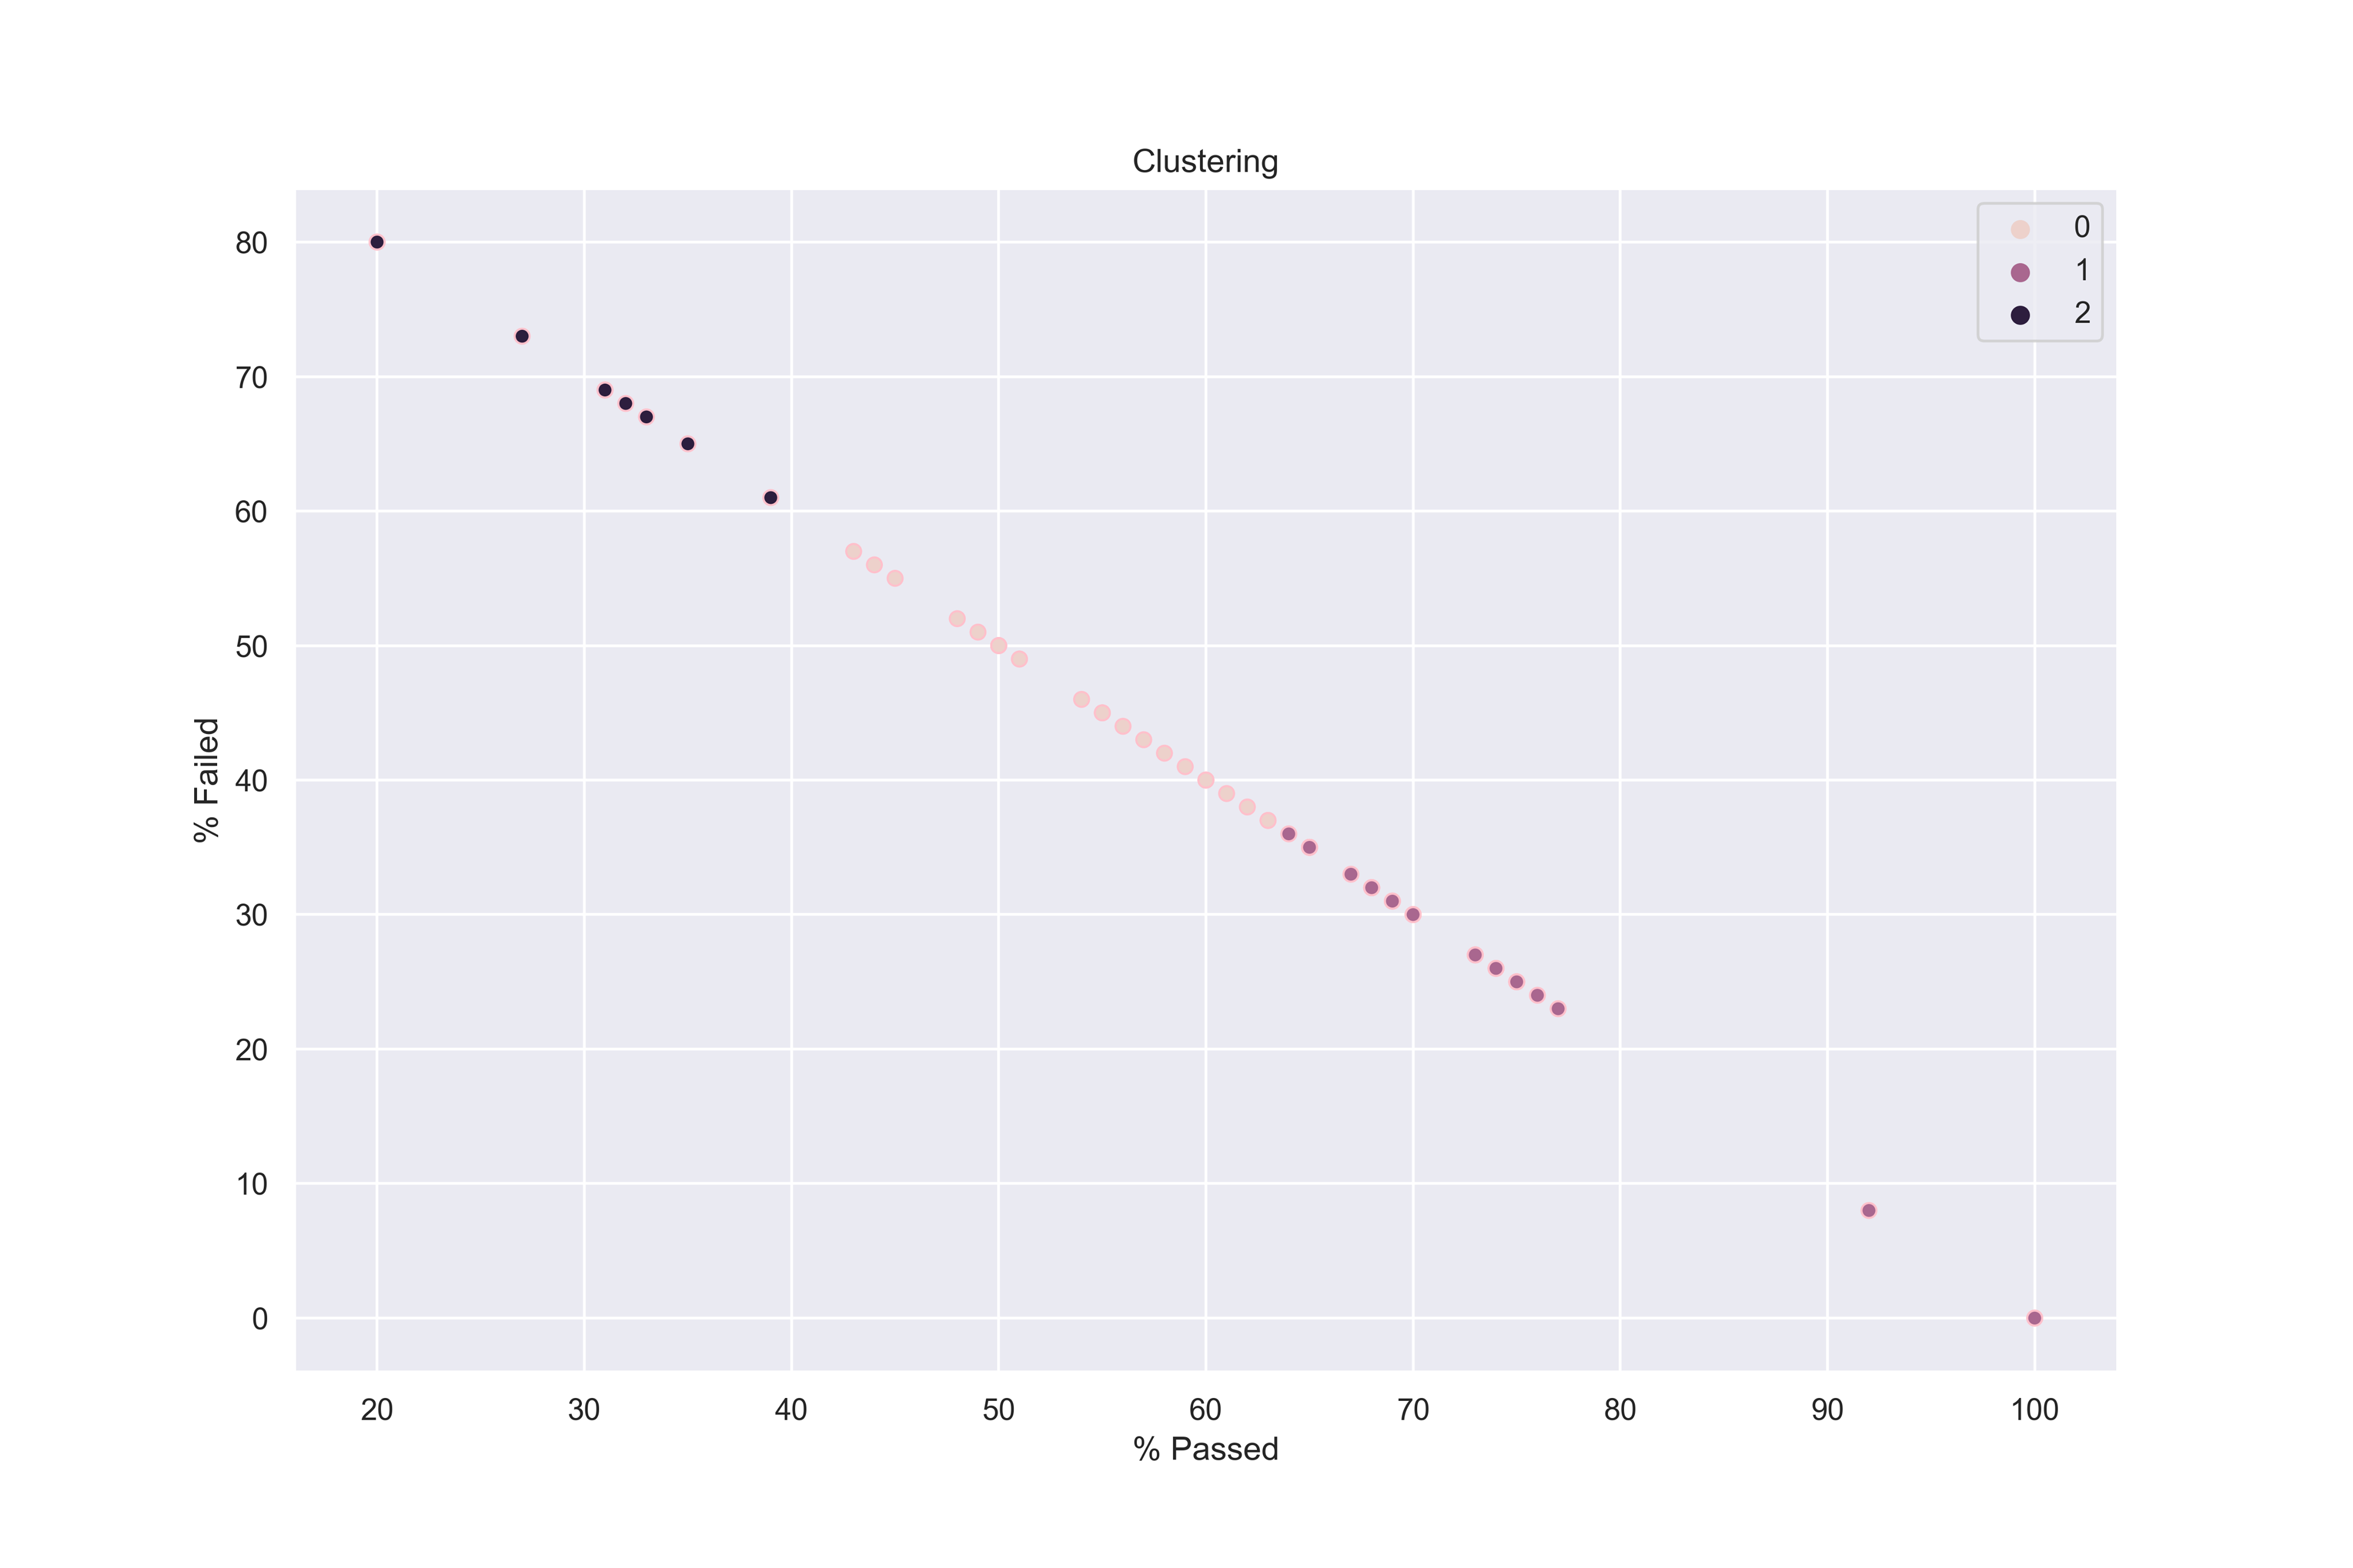
First, we performed clustering on the inspections performed up to 01.07.2018.
We identified 3 categories of violations based on the clustering done above:
Normal and minor violations
Those violations which do not concern food directly and are not a direct threat to people's health. They mostly concern:
Severe violations
Those violations which have an important amount of failed and passed with conditions proportions as they can jeopardize people's health. They mostly concern:
Critical violations
These violations seriously endanger customer's health and can be at the origin of food-related illnesses. They concern:
This clustering was realised based on the proportion of passed/failed/passed with conditions inspections. Our categories broadly match a classification we found on the city of Chicago website:
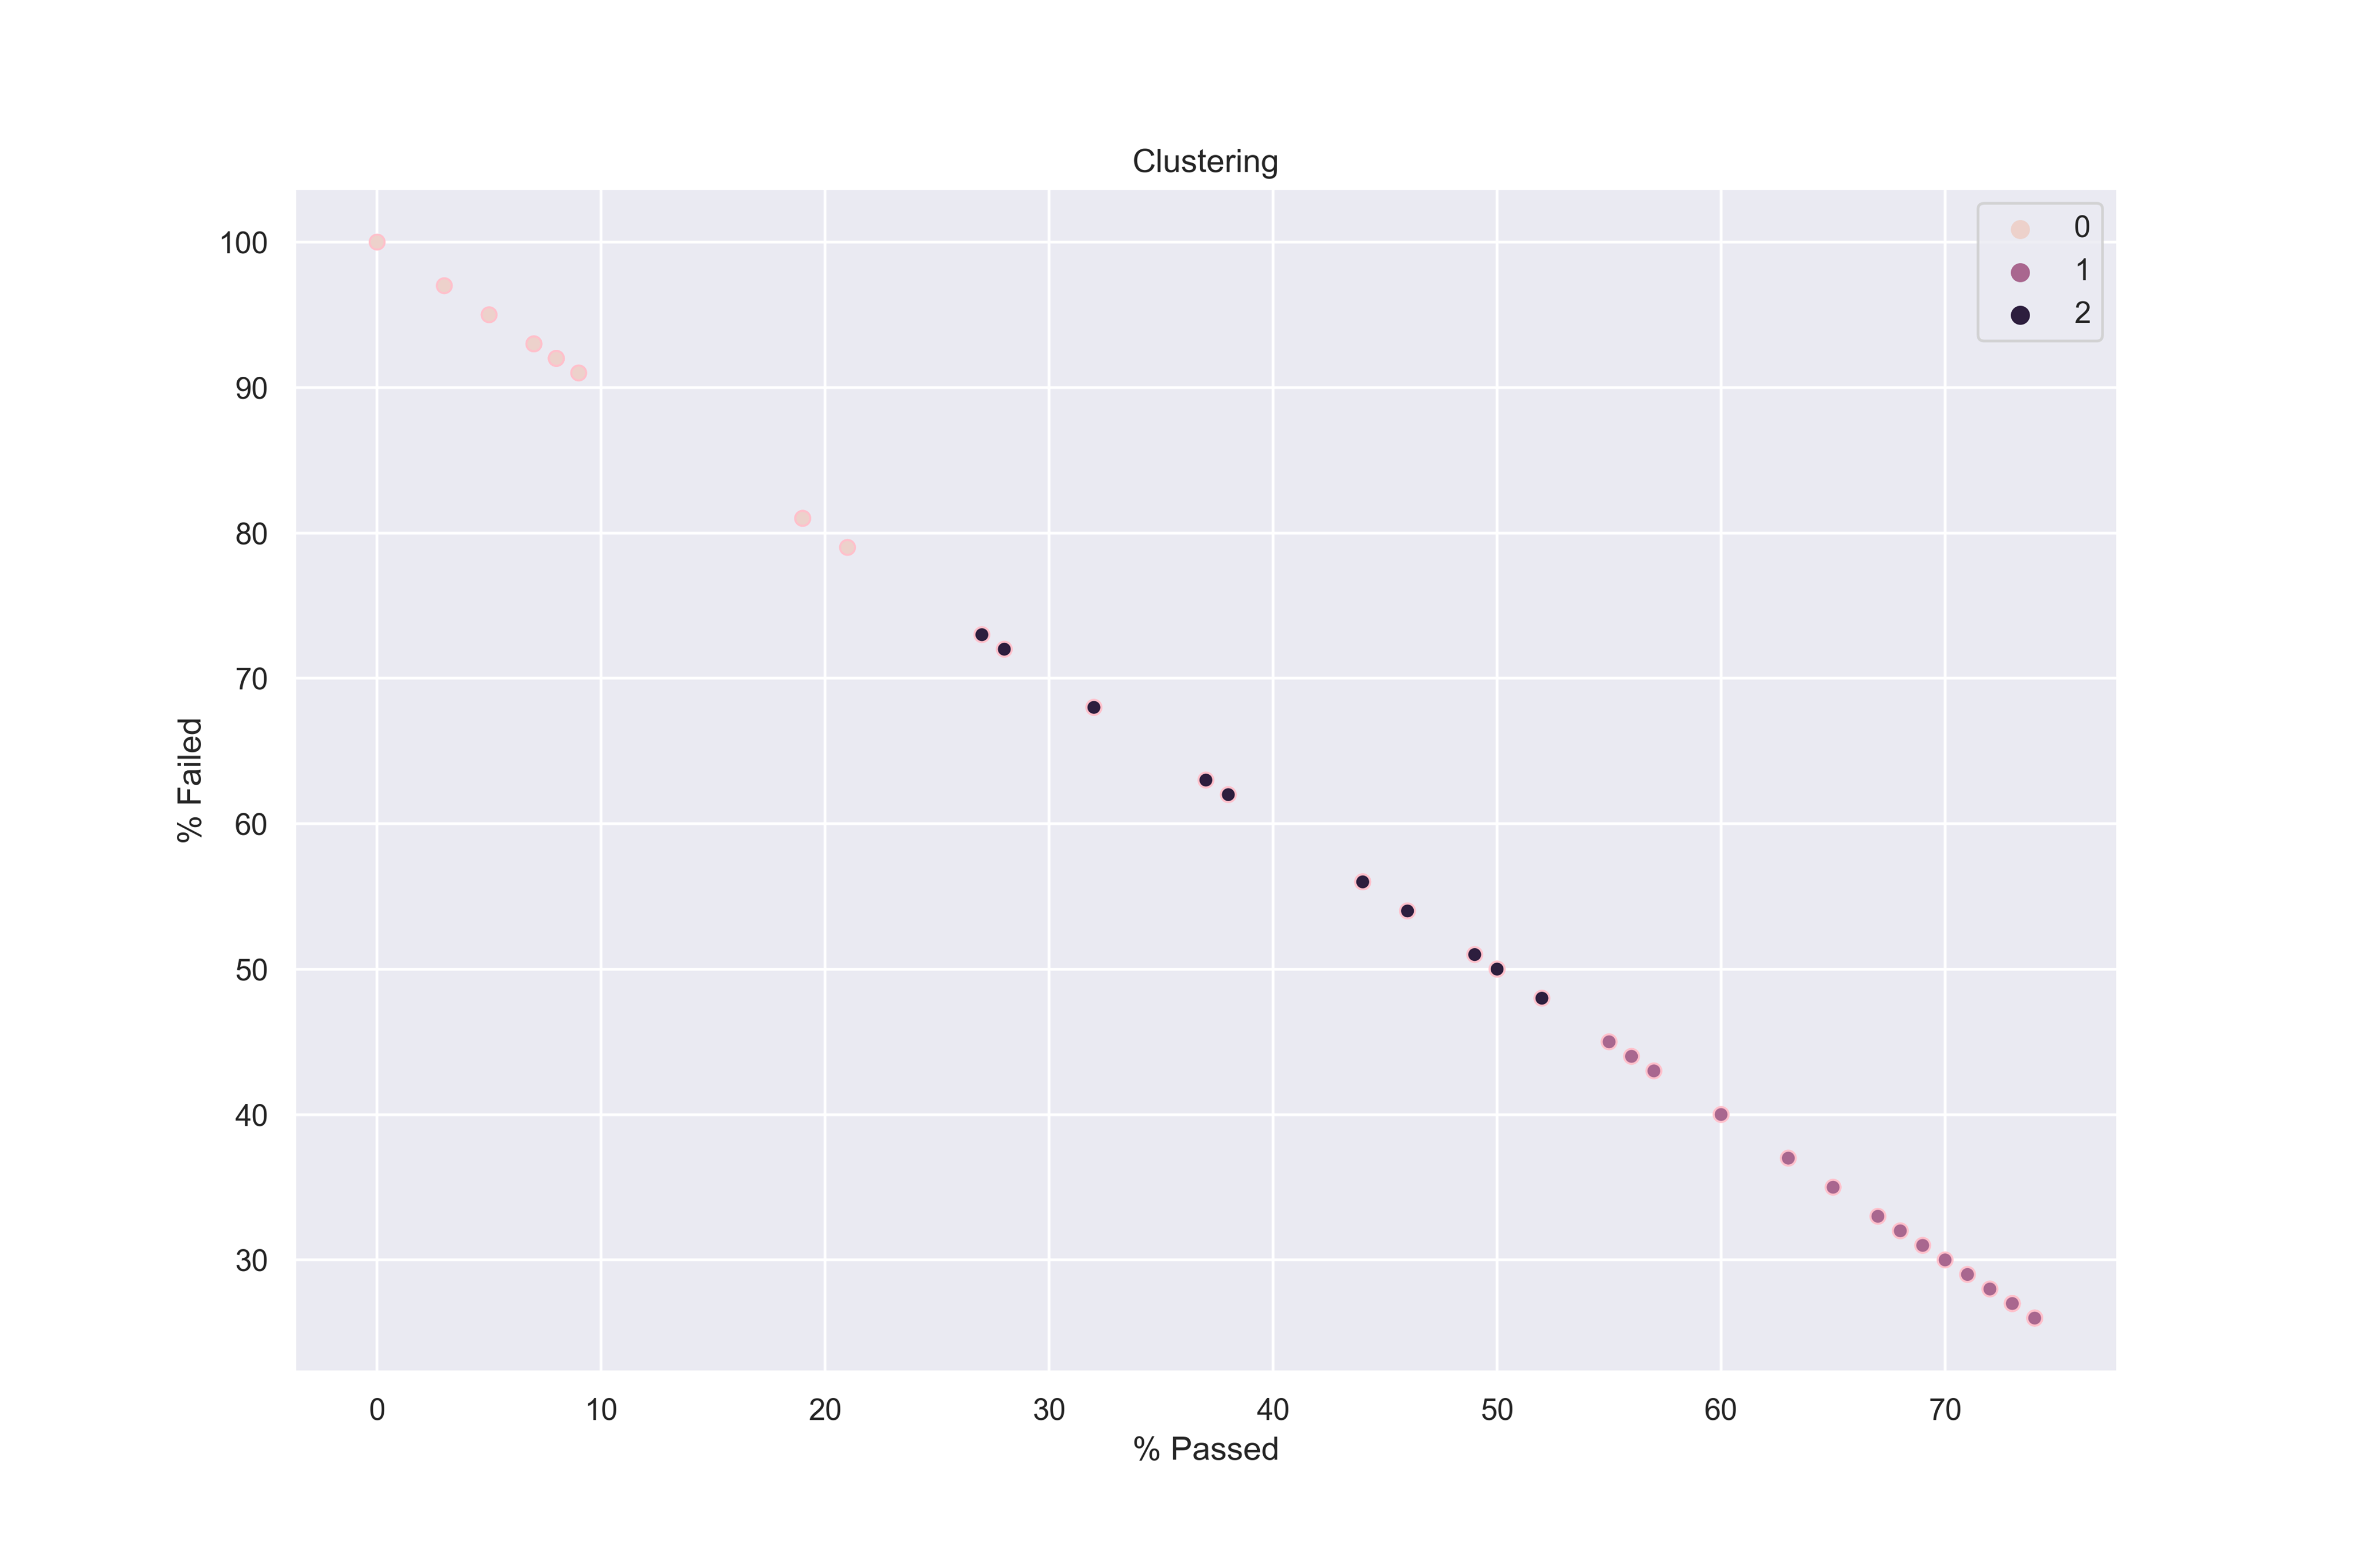
Our method to classify the violations (clustering by kNN) actually makes sense based on the website: minor violations have a small rate of fail and an important proportion of pass (our first cluster), severe violations have an important amount of passed with conditions (if a severe violation occurs, the facility gets a passed with conditions if this violation is corrected - this is our second cluster). Finally, the critical violations have a proportion of failed inspections above 70% - our third cluster. We applied the same type of clustering for the second part of the dataset containing the inspections following 7/1/2018:
For the second part of the dataset, the clustering is less obvious: we observed a serious decay in the proportion of passed violations. We tried to cluster the violations in 2, 3 and 4 clusters, but there is always a cluster containing only 2 violations. Therefore, we decided to stick with 2 clusters.
We identified the same patterns as before, the most critical violations include real dangers to the customers' health: the presence of rodents (38), handling of toxic substances (28), temperature control (33), water source (31), cooking conditions (34).
By shedding light on how the different violations can be classified in different categories (Minor, Severe and Critical), and how they contribute to the result of an inspection, we were able to use this information later on to build our models and perform meaningful feature extraction.
First, we performed clustering on the inspections performed up to 01.07.2018.
We identified 3 categories of violations based on the clustering done above:
Normal and minor violations
Those violations which do not concern food directly and are not a direct threat to people's health. They mostly concern:
- The premises: floor, ceiling, ventilation, toilets.
- Access to only authorized personnel in the food area.
- Cleaning, the utensils, the different restrictions.
Severe violations
Those violations which have an important amount of failed and passed with conditions proportions as they can jeopardize people's health. They mostly concern:
- The storage of the food: good temperature, thawing, labeling of the food.
- Contamination issues: toxic elements are well stored, people with infections are kept away from the food area.
- Hygienic practices.
- Presence of a food manager on site.
- Prohibition of reserving unwrapped food.
- Smoking restrictions.
Critical violations
These violations seriously endanger customer's health and can be at the origin of food-related illnesses. They concern:
- Food protection and storage: protection from rodents, food stored at the right temperature.
- Rodent/insects/other animals infestation.
- Handling of utensils and dishes: washed, rinsed and scraped.
- Water sources: hot water, city pressure.
This clustering was realised based on the proportion of passed/failed/passed with conditions inspections. Our categories broadly match a classification we found on the city of Chicago website:
Our method to classify the violations (clustering by kNN) actually makes sense based on the website: minor violations have a small rate of fail and an important proportion of pass (our first cluster), severe violations have an important amount of passed with conditions (if a severe violation occurs, the facility gets a passed with conditions if this violation is corrected - this is our second cluster). Finally, the critical violations have a proportion of failed inspections above 70% - our third cluster. We applied the same type of clustering for the second part of the dataset containing the inspections following 7/1/2018:
For the second part of the dataset, the clustering is less obvious: we observed a serious decay in the proportion of passed violations. We tried to cluster the violations in 2, 3 and 4 clusters, but there is always a cluster containing only 2 violations. Therefore, we decided to stick with 2 clusters.
We identified the same patterns as before, the most critical violations include real dangers to the customers' health: the presence of rodents (38), handling of toxic substances (28), temperature control (33), water source (31), cooking conditions (34).
By shedding light on how the different violations can be classified in different categories (Minor, Severe and Critical), and how they contribute to the result of an inspection, we were able to use this information later on to build our models and perform meaningful feature extraction.
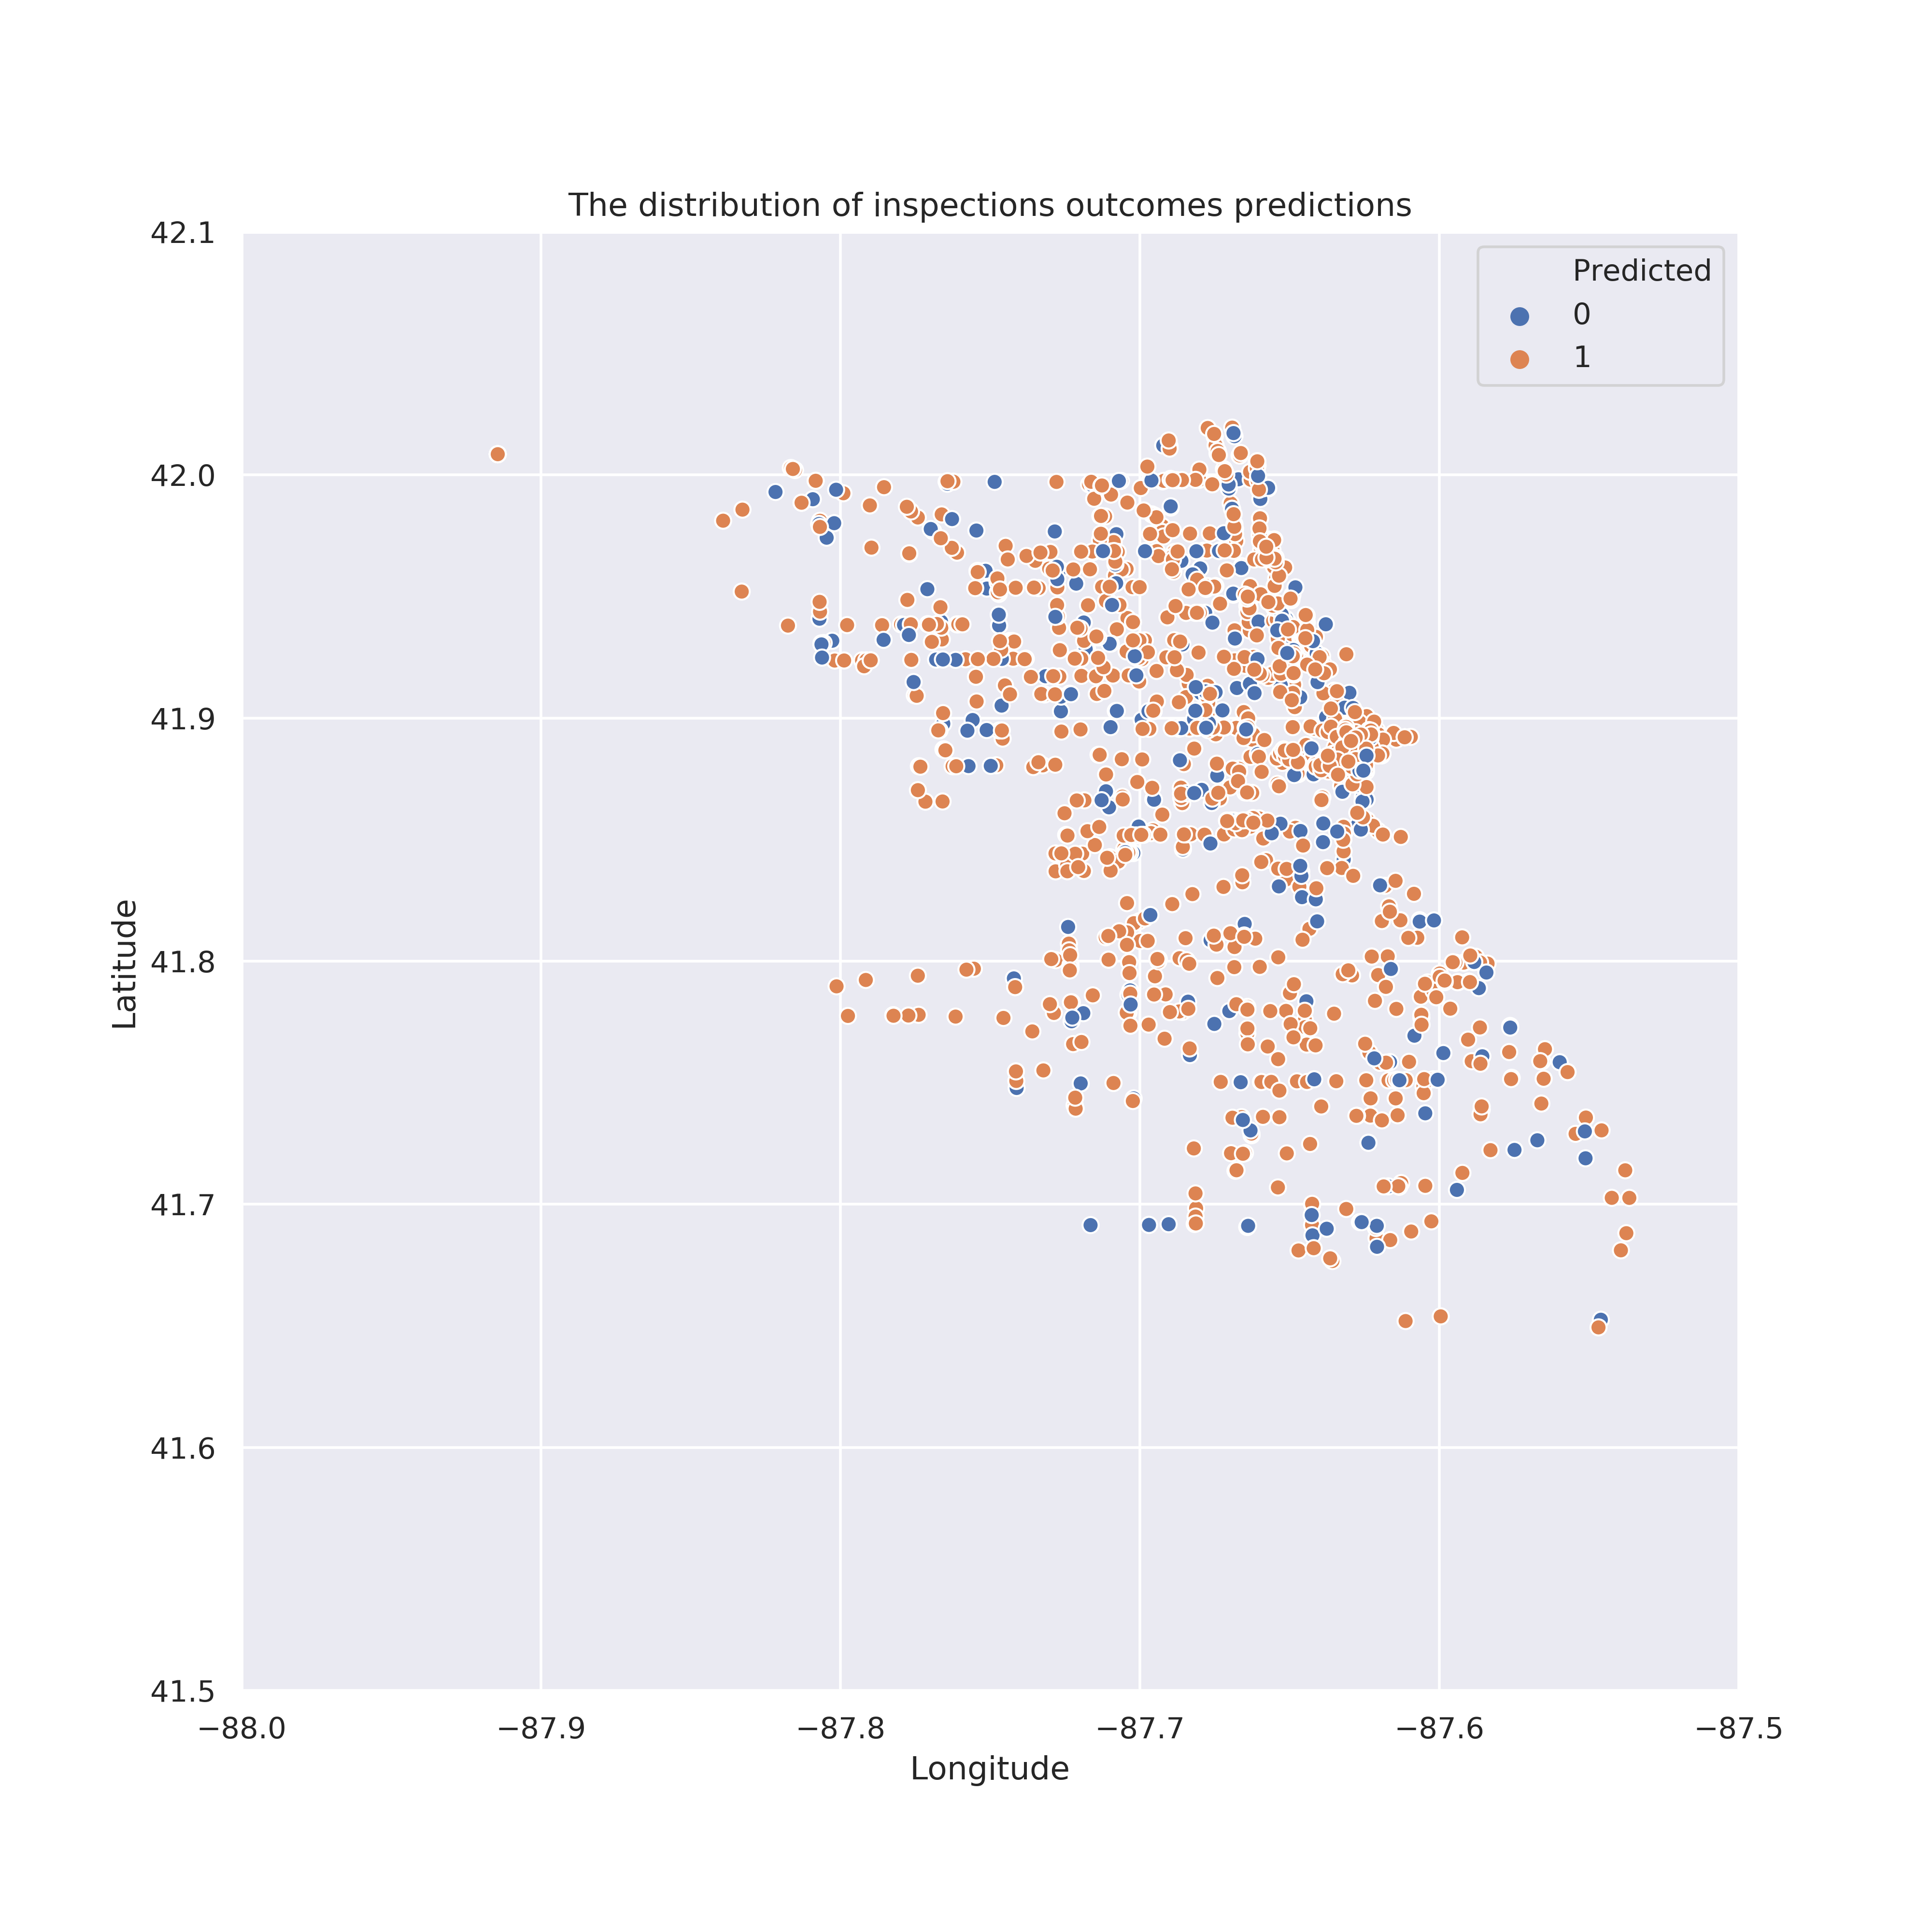
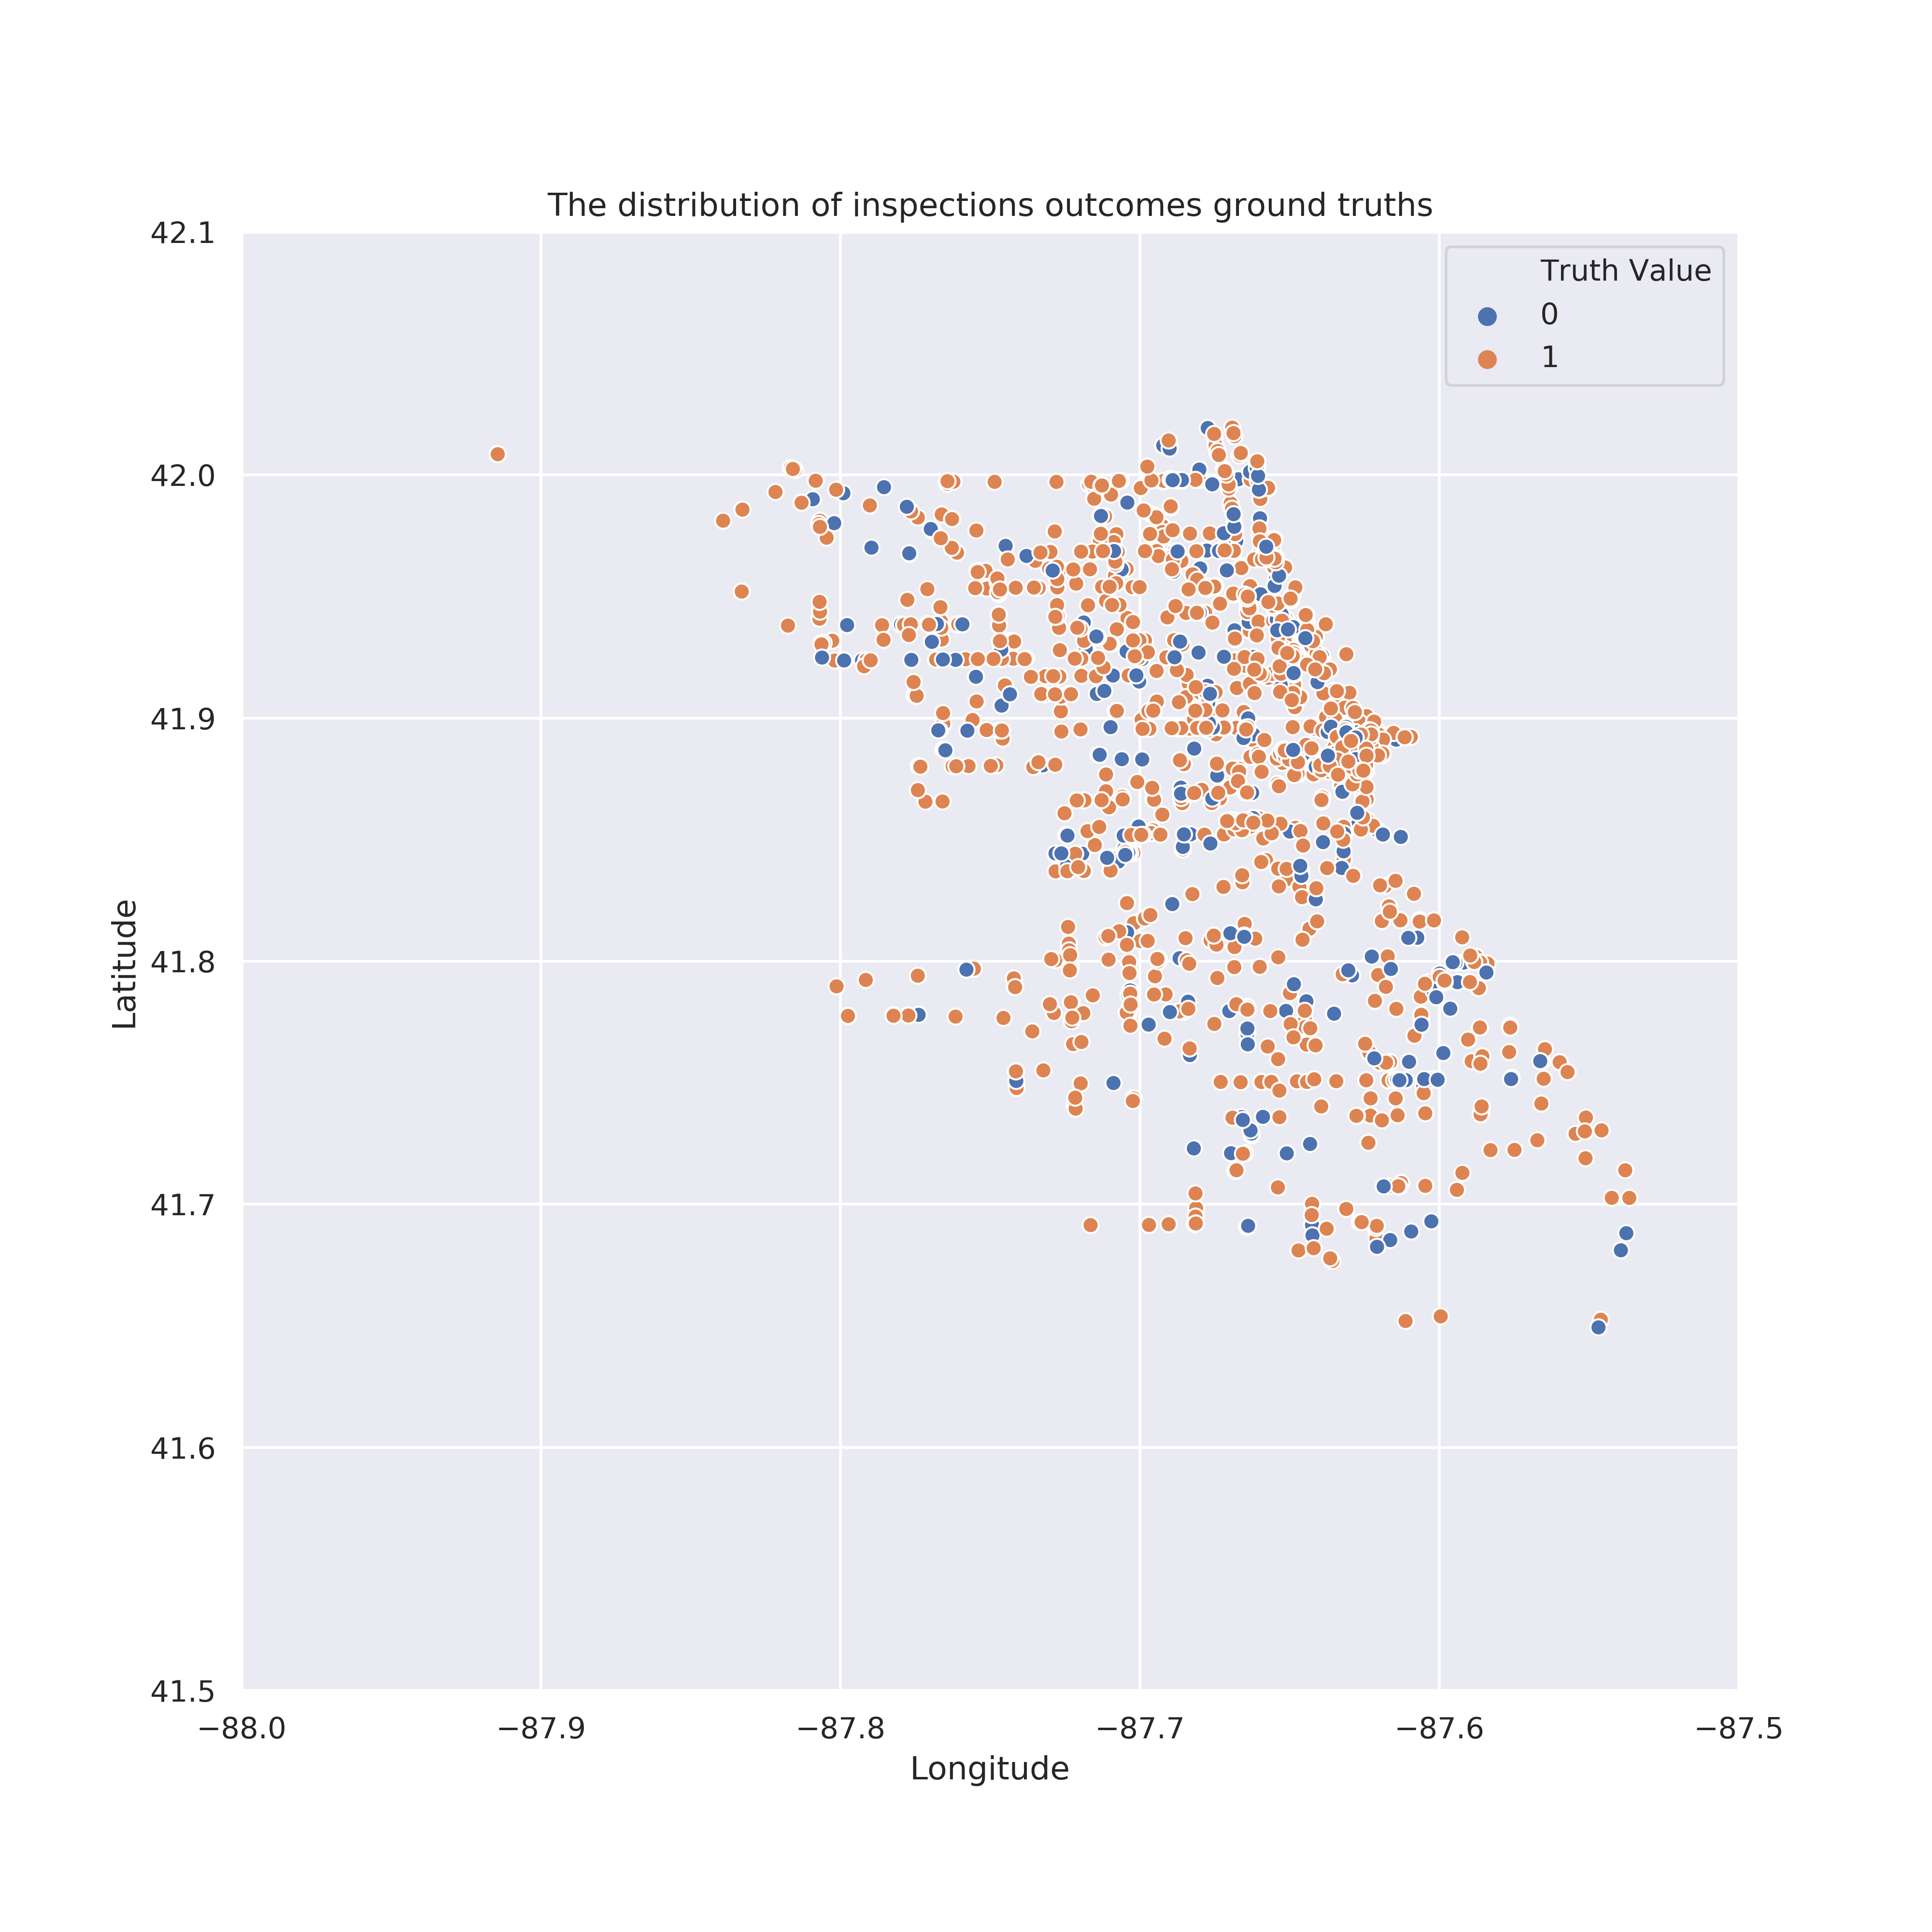
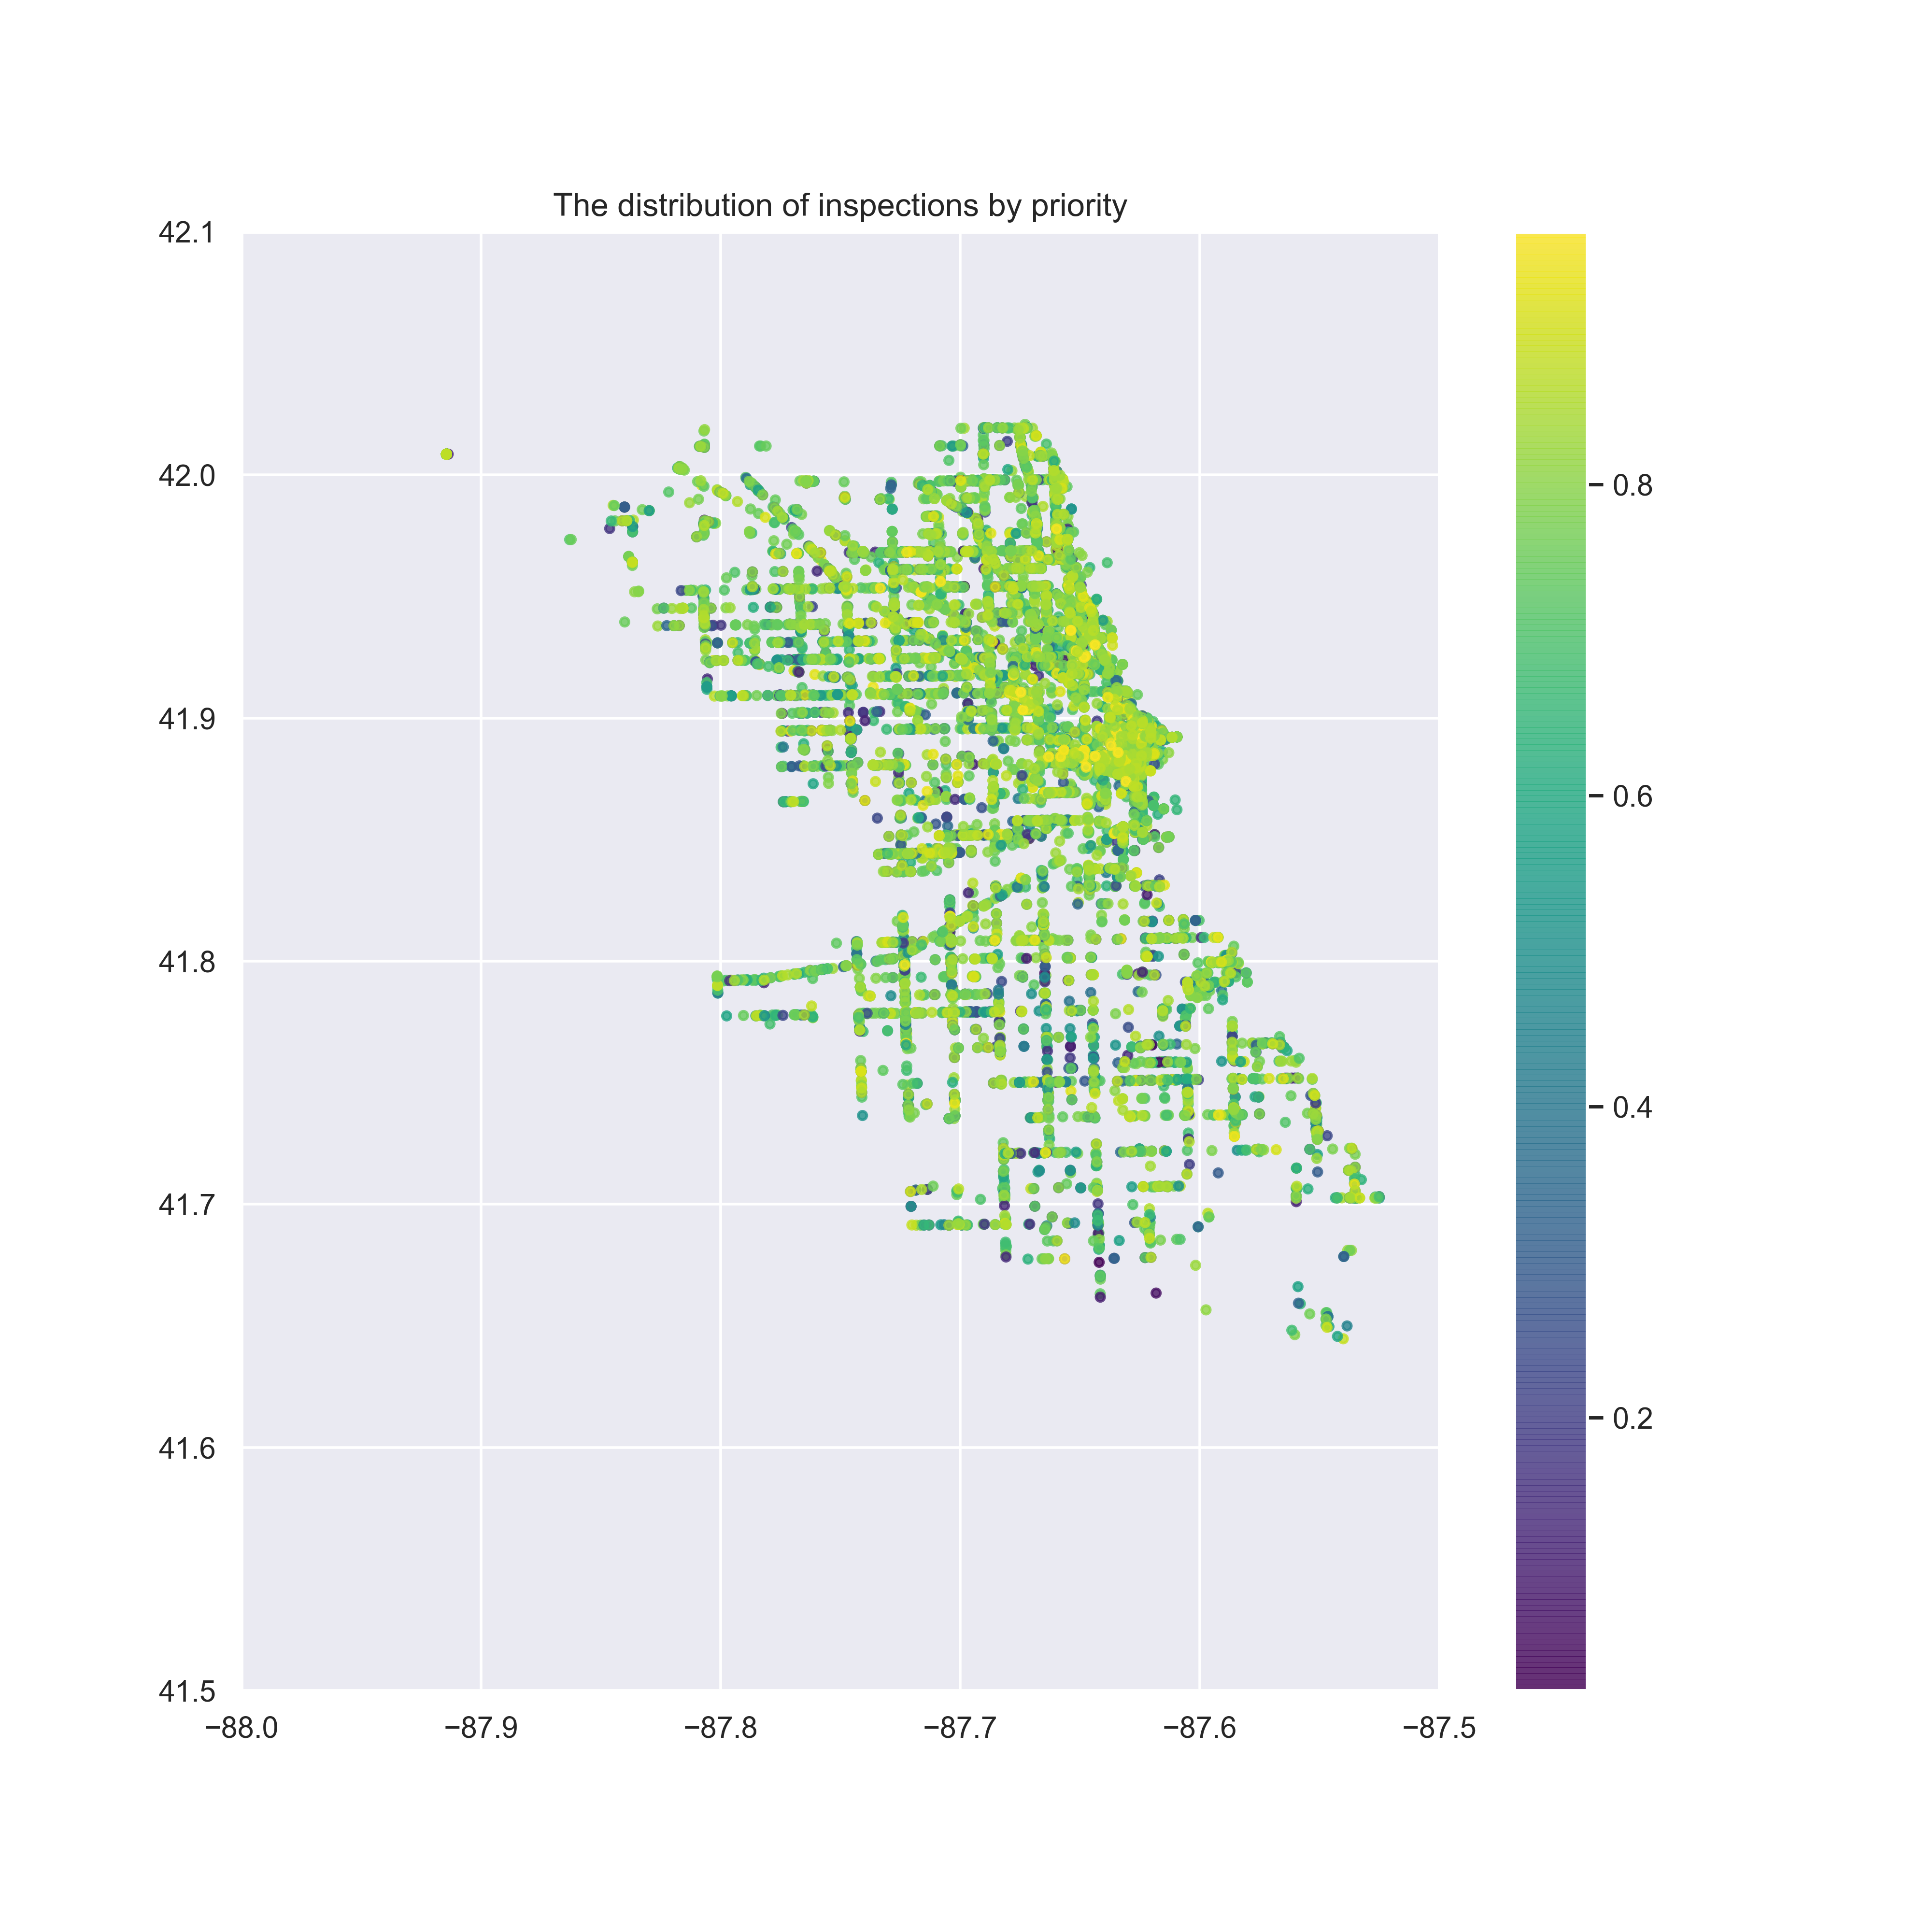
How are different risk levels localised across the map of Chicago?
As the data file contains the Latitude and Longitude for a large majority of the inspected facilities, we wanted to analyse the localisation of the different risk levels in relation to the average income per capita. To do so, we randomly sampled only 1000 establishments in order to be able to visualize them.
The map above shows that food establishments with low (green) and medium (orange) risk tend to somewhat cluster together (this would be more evident if we could plot all the establishments on the map). The various underlying shades of purple (visible if you zoom in) show the different average income per capita in the areas of Chicago. Thus, surprisingly, the average income per capita in the area is irrelevant when it comes to the prevalent food establishments' risks. Our original assumption was that richer areas will be host to more low risk facilities, but unfortunately they too have the problem of a high risk majority.
The map above shows that food establishments with low (green) and medium (orange) risk tend to somewhat cluster together (this would be more evident if we could plot all the establishments on the map). The various underlying shades of purple (visible if you zoom in) show the different average income per capita in the areas of Chicago. Thus, surprisingly, the average income per capita in the area is irrelevant when it comes to the prevalent food establishments' risks. Our original assumption was that richer areas will be host to more low risk facilities, but unfortunately they too have the problem of a high risk majority.
How do the inspections outcomes results vary over the years?
We also enquired whether there exist significant changes over the years in the distribution of inspections results.
A change in the results occurs between 2017 and 2018: less Pass and more Pass with conditions. It is linked to the change in the violations codes in July 2018, and the inspections seem to have also become stricter since then.
A change in the results occurs between 2017 and 2018: less Pass and more Pass with conditions. It is linked to the change in the violations codes in July 2018, and the inspections seem to have also become stricter since then.
Are there any seasonal patterns affecting the inspections outcomes?
We then wondered if there exist seasonal patterns in our data, for instance, if we have a change in the proportion of Pass / Fail inspections during certain months of the year.
The plot above, even though simple, illustrates there is seasonality in the months of July, August and September. More precisely, during these months it seems that the average percentage of Pass inspections (over all years) decreases while the Fail increases. In retrospective, this is reasonable as the hot summer months tend to make it more difficult to store meat and other animal-derived ingredients, avoid rodents and insects, as well as maintain a comfortable temperature for the customers. Note that we considered both Pass and Pass w/ Conditions to be a Pass.
Overall, our analysis so far revealed that inspections seem to get stricter after 2017, with a higher proportion of Passed with conditions than Pass inspections. The main reason is that the violations codes changed in July 2018, thus implying a change in the way inspections are performed. If we take a look at the evolution of the results over the months, there is a clear increase in the Fail inspections proportion during summer: the risk of having temperature issues with the food, dysfunctional thermostats or infestations (rodents, insects) is higher. Since these violations usually make inspections fail, it is normal to observe this increase.
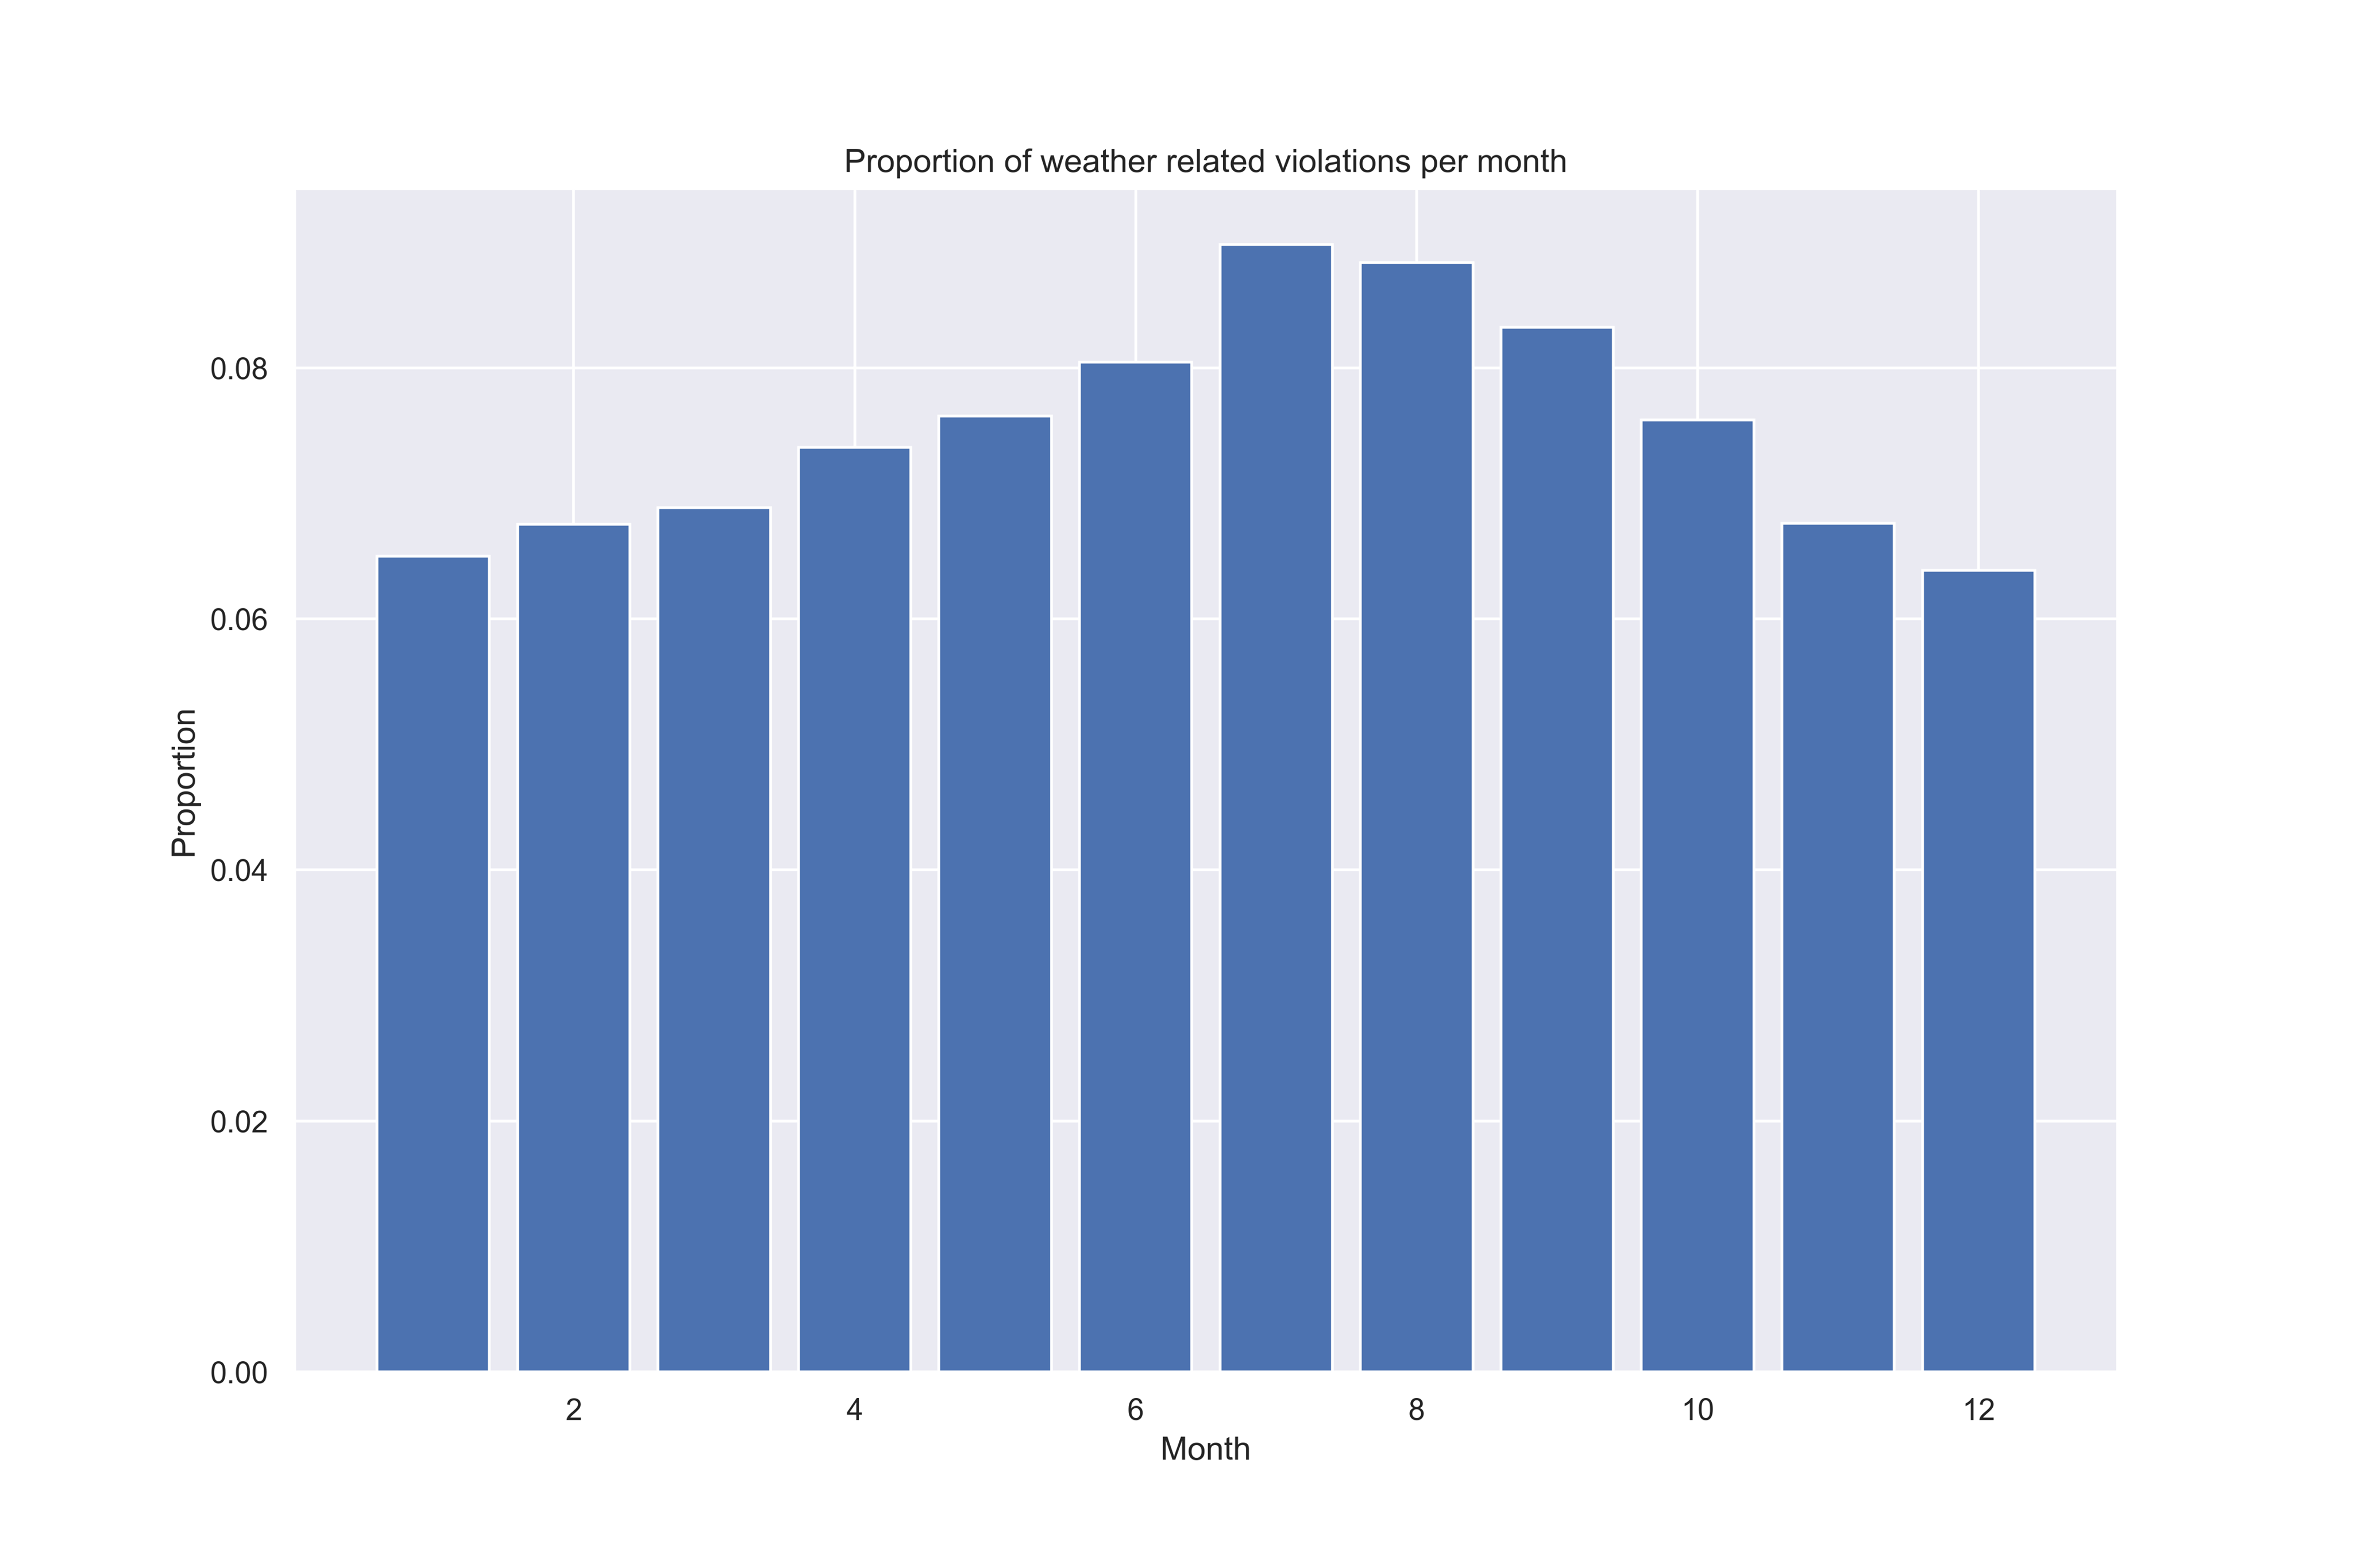
The weather-related violations are linked to: temperature, rodents, insects... By looking at the proportions of these critical violations per month, we can see again that their proportion is higher during summer, especially in August and July. Indeed, during summertime, establishments are more likely to encounter issues to preserve food at the right temperature, to keep it cold and to maintain adequate ventilation. Besides, heat can cause the proliferation of insects especially around garbage and the smell can drive rodents. This is why this is a period of time when inspectors need to watch out for this kind of violations. Moreover, this finding supports the above plot illustrating that more inspections tend to fail during the months of July, August and September.
The plot above, even though simple, illustrates there is seasonality in the months of July, August and September. More precisely, during these months it seems that the average percentage of Pass inspections (over all years) decreases while the Fail increases. In retrospective, this is reasonable as the hot summer months tend to make it more difficult to store meat and other animal-derived ingredients, avoid rodents and insects, as well as maintain a comfortable temperature for the customers. Note that we considered both Pass and Pass w/ Conditions to be a Pass.
Overall, our analysis so far revealed that inspections seem to get stricter after 2017, with a higher proportion of Passed with conditions than Pass inspections. The main reason is that the violations codes changed in July 2018, thus implying a change in the way inspections are performed. If we take a look at the evolution of the results over the months, there is a clear increase in the Fail inspections proportion during summer: the risk of having temperature issues with the food, dysfunctional thermostats or infestations (rodents, insects) is higher. Since these violations usually make inspections fail, it is normal to observe this increase.
The weather-related violations are linked to: temperature, rodents, insects... By looking at the proportions of these critical violations per month, we can see again that their proportion is higher during summer, especially in August and July. Indeed, during summertime, establishments are more likely to encounter issues to preserve food at the right temperature, to keep it cold and to maintain adequate ventilation. Besides, heat can cause the proliferation of insects especially around garbage and the smell can drive rodents. This is why this is a period of time when inspectors need to watch out for this kind of violations. Moreover, this finding supports the above plot illustrating that more inspections tend to fail during the months of July, August and September.